XB-IMG-175678
Xenbase Image ID: 175678
|
|
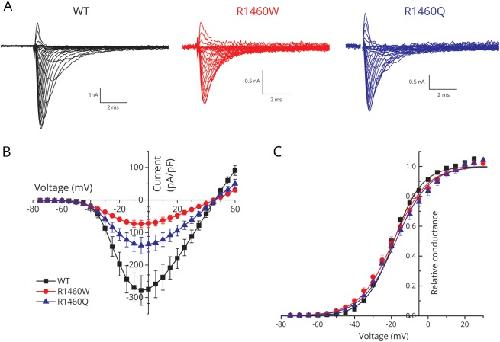
Figure 2. Sodium current density was reduced for cells transfected with R1460 mutant constructs, but the voltage dependence of activation was not altered(A) Traces show sodium currents elicited by depolarization from −120 mV to test potentials between −75 and +60 mV. Note the higher gain for the scale bars in the mutant channel traces. (B) Peak current density is shown as a function of test potential and displays a marked reduction in current amplitude for both mutants. (C) The voltage dependence of channel activation, as shown by relative conductance, was indistinguishable between the wild-type (WT) and mutant channels. Black squares, blue triangles, and red circles correspond to WT (n = 16), R1460Q (n = 12), and R1460W (n = 16), respectively. Image published in: Elia N et al. (2019) Copyright © 2019 The Author(s). Creative Commons Attribution license Larger Image Printer Friendly View |