XB-IMG-122690
Xenbase Image ID: 122690
|
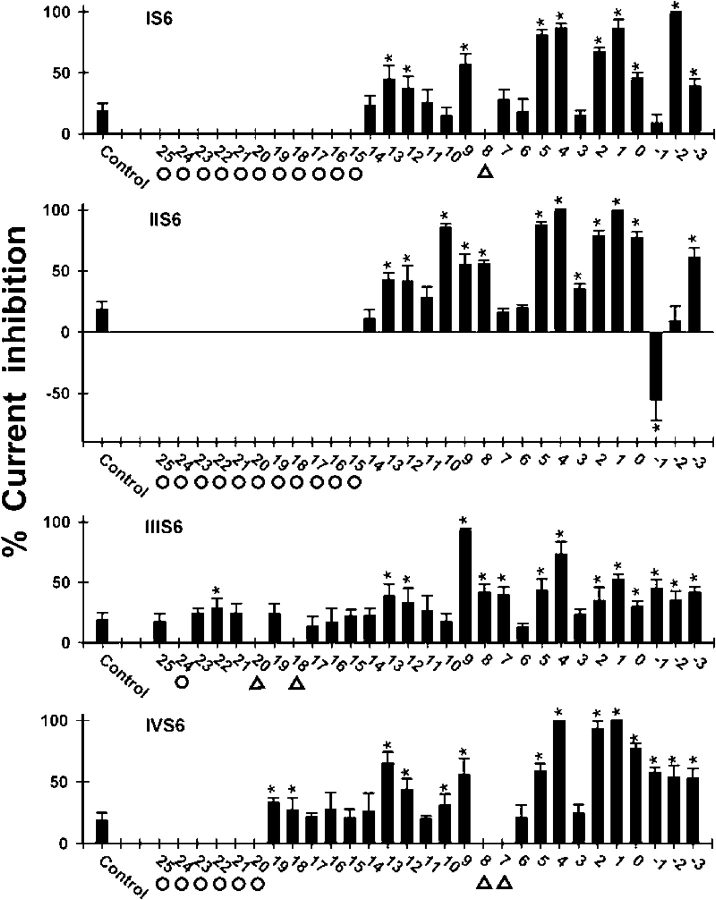
Figure 3. Summary of the effect of MTSET on S6 mutant channels. Bars represent current inhibition by 4 mM internal MTSET on the control channel (n = 20) and S6 cysteine mutant channels (n = 3–15). Stars indicate mutant channels that were significantly inhibited compared with the control channel (P < 0.05). Circles and triangles indicate, respectively, positions that were either not mutated or mutated but failed to produce functional channels. Original data are summarized in Tables I−IV. Experiment conditions were the same as in Fig. 4 A. Image published in: Zhen XG et al. (2005) Copyright © 2005, The Rockefeller University Press. Creative Commons Attribution-NonCommercial-ShareAlike license Larger Image Printer Friendly View |