XB-IMG-178520
Xenbase Image ID: 178520
|
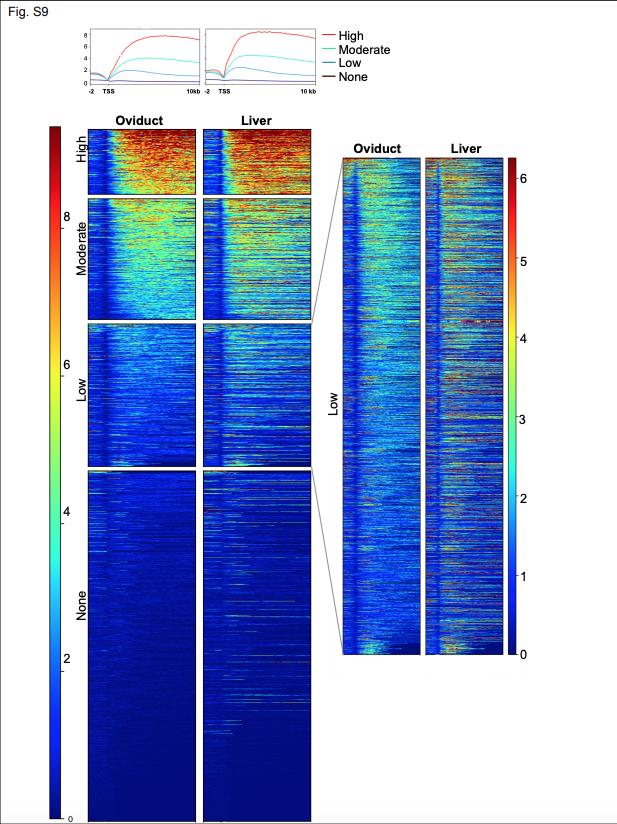
Figure S9: A heatmap of H2bub1 Chip-seq
H2B ubiquitination surrounding the transcription start site (TSS) (-1Kb, + 10Kb) in ciliated tissue (oviduct) and non-ciliated tissue (liver). Genes are grouped by H2Bub1 levels into four clusters: high, moderate, low, and none. The average profile, depicted using fold enrichment against random distribution values, across this region for each cluster in each tissue is shown above the heatmap. A zoomed in heatmap of the "low" cluster highlights the differences between the ciliated and non-ciliated tissues. Image published in: Robson A et al. (2019) Copyright © 2019. Image reproduced with permission of the Publisher and the copyright holder. This is an Open Access article distributed under the terms of the Creative Commons Attribution License. Larger Image Printer Friendly View |