XB-IMG-120048
Xenbase Image ID: 120048
|
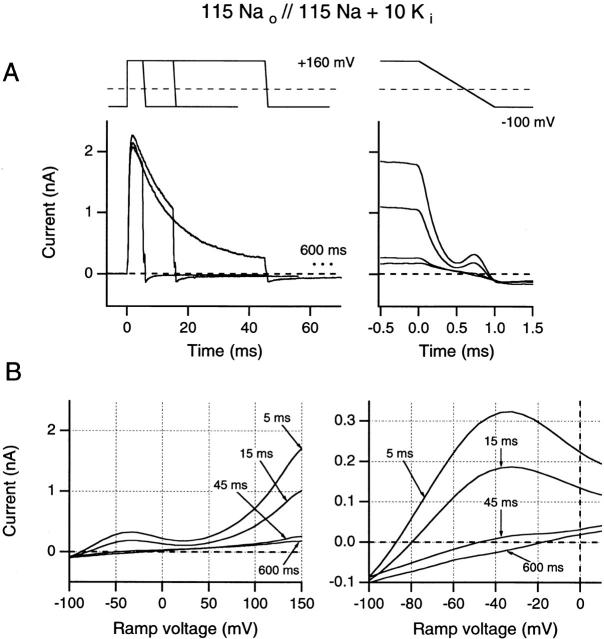
Figure 6. Effects of increasing test pulse duration on ramp I-V curves recorded after test pulses to +160 mV. (A) Ramp currents are plotted against time. (B) Ramp currents are plotted against ramp potential. Same format as in Fig. 5. All data are from the same inside-out patch as in Fig. 5. Image published in: Starkus JG et al. (2000) © 2000 The Rockefeller University Press. Creative Commons Attribution-NonCommercial-ShareAlike license Larger Image Printer Friendly View |