XB-IMG-128442
Xenbase Image ID: 128442
|
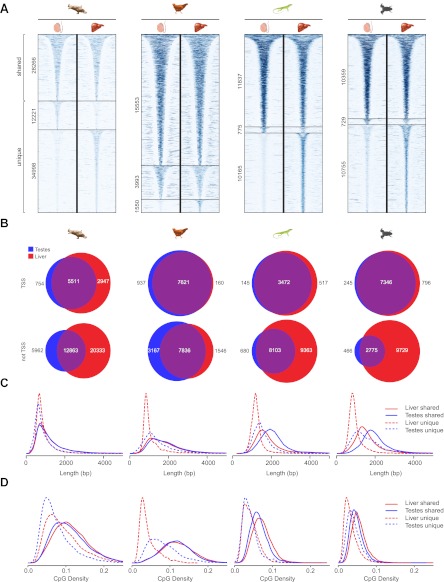
Figure 5—figure supplement 2. Differential methylation of NMIs in platypus, chicken, lizard and frog and length distributions of NMIs from all seven vertebrates.(A) A heat map of non-methylated DNA signal from testes and liver in platypus, chicken, lizard and frog. In each case NMIs are ranked according to length and clustered as shared (upper) or unique (lower) between the two tissues. A 5-kb window centred at the NMI is shown and read density is indicated by colour intensity. (B) Venn diagrams demonstrate that shared NMIs are found predominantly at protein-coding gene TSSs (upper) and unique NMIs tend to be found away from TSSs (lower). (C) NMI length distribution plots for shared (Shared NMIs, solid line) or unique (Unique NMIs, dashed line) NMIs from testes (blue) or liver (red). Shared NMIs tend to be longer than tissue-specific unique NMIs. (D) CpG density distribution plots for shared (solid line) or unique (dashed line) NMIs from testes (blue) or liver (red). Shared NMIs tend to have higher CpG density than unique NMIs.DOI:
http://dx.doi.org/10.7554/eLife.00348.010 Image published in: Long HK et al. (2013) Copyright © 2013, Long et al. Creative Commons Attribution license Larger Image Printer Friendly View |