XB-IMG-121110
Xenbase Image ID: 121110
|
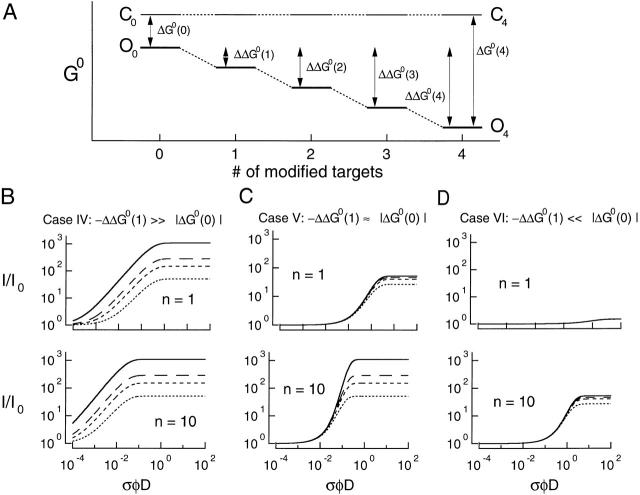
Figure 13. Energy additive model for increase in channel open probability by UV light. (A) Schematic showing effect of modifying (−) targets (see text) on the standard free energy difference between the channels' open and closed states. Symbols are equivalent to those in Fig. 4. (B–D) UV dose–response relations calculated using energy additive model. Smooth curves were calculated using for the following ΔG 0(0) values (RT units): +7.0 (solid line), +5.7 (long-dashed line),+5.0 (medium-dashed line), and +3.9 (short-dashed line). ΔΔG 0(1) values (RT units) were: (B) −40; (C) −1; and (D) −0.1. The top and bottom set of curves in each panel were calculated for 1 and 10 (−) target residues per channel subunit, respectively. Image published in: Middendorf TR and Aldrich RW (2000) © 2000 The Rockefeller University Press. Creative Commons Attribution-NonCommercial-ShareAlike license Larger Image Printer Friendly View |