XB-IMG-195573
Xenbase Image ID: 195573
|
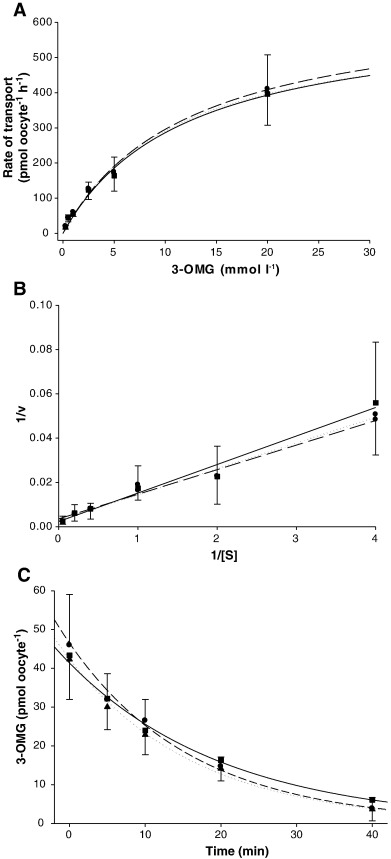
Fig. 3. Kinetics of glucose transport in Xenopus oocytes expressing RsOH-GLUT2 (▲, dashed line), RsAK-GLUT2 (●, dotted line), or Rp-GLUT2 (■, solid line). Prior to the assay, oocytes were injected with 50 nl of GLUT2 cRNA (300 ng μl− 1). A: 3-O-methyl-d-glucose (3-OMG) uptake measured under zero-trans conditions at various 3-OMG concentrations. Uptake values reflect measured 3-OMG concentrations minus average values obtained for respective sham-injected oocytes. B: Lineweaver–Burk plot from the linearization of data acquired in zero-trans kinetic studies. Values are means ± SEM. (n = 8–10 oocytes). C: 3-OMG export was measured under zero-trans conditions at various times. Export values reflect measured 3-OMG concentrations minus average values obtained for respective sham-injected oocytes. Values are means ± SEM (n = 8–10 oocytes). Image published in: Rosendale AJ et al. (2014) Copyright © 2014. Image reproduced with permission of the Publisher, Elsevier B. V. Larger Image Printer Friendly View |