XB-IMG-129253
Xenbase Image ID: 129253

|
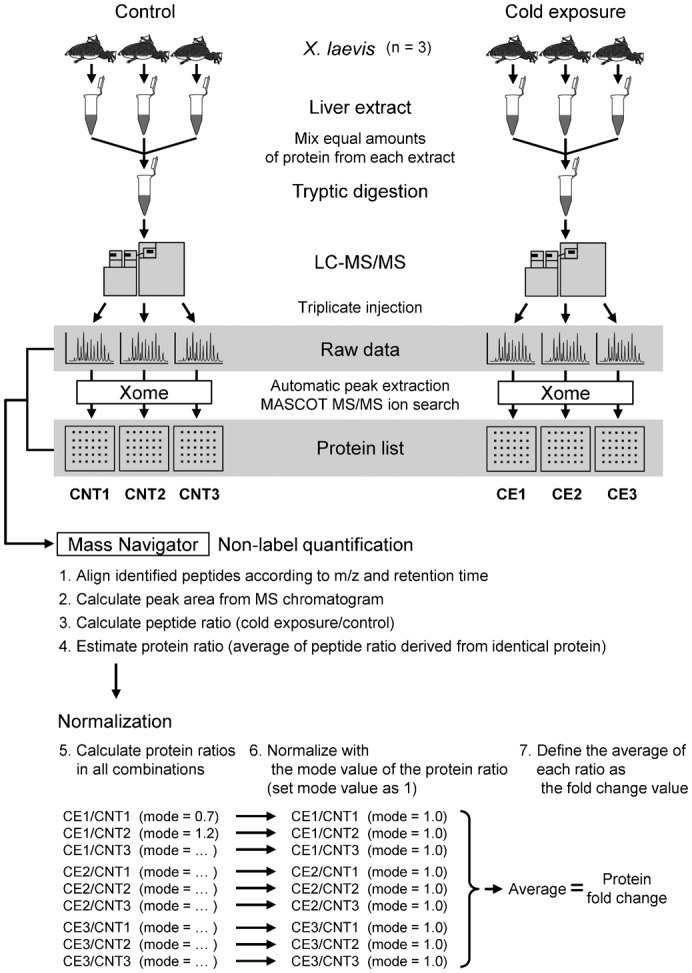
Fig. 2. Schematic view of sample and data processing.Each test sample, i.e. a protein extract mixture derived from three frogs prepared by bead crusher, was subjected to tryptic digestion. Subsequent nanoLC–MS/MS analysis was repeated three times. Automatic peak extraction and MASCOT MS/MS ion search were performed using Xome software. The triplicate data were processed individually in all combinations to calculate the protein ratios by non-label quantification using Mass Navigator software then protein ratios were averaged after normalization. The details are explained in the Materials and Methods and in Table 1. Image published in: Nagasawa K et al. (2013) © 2013. Creative Commons Attribution license Larger Image Printer Friendly View |
