XB-IMG-123413
Xenbase Image ID: 123413
|
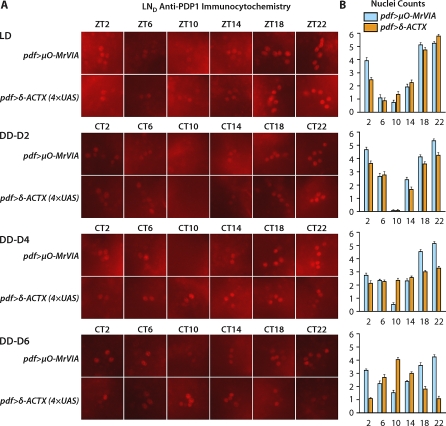
Figure 10. Membrane-Tethered δ-ACTX-Hv1a Expression in LNV Neurons Induces Short Period of PDP1 Oscillation in LNDs in DDRed anti-PDP1 immunofluorescence (A) reveals PDP1 accumulation in LND nuclei. Bar graphs (B) show the number of neurons labeled with anti-PDP1 immunofluorescence (mean ± SEM). Control pdf>μO-MrVIA flies exhibit a similar temporal pattern of PDP1 accumulation in the LNDs as in the sLNVs, with peak centered around CT22 (p < 0.001). Experimental pdf>δ-ACTX-Hv1a flies exhibit similar temporal pattern of PDP1 oscillation to control pdf>μO-MrVIA flies on DD-D2 with peak at CT22 and trough at CT10. On DD-D4, LNDs of pdf>δ-ACTX-Hv1a flies exhibit damped peak of PDP1 oscillation at CT22 and trough at CT2-CT6 (p < 0.001). However, by DD-D6, a phase advance of PDP1 accumulation in the nuclei of LNDs induced by δ-ACTX-Hv1a expression manifests, with a peak at CT10 and trough at CT22-CT2 (p < 0.001). δ-ACTX-Hv1a expression in LNVs does not affect PDP1 oscillation in LND neurons in LD. Differences among different genotypes at different circadian times were compared using ANOVA with Tukey-Kramer multiple comparisons. n > 22 brain hemispheres for each experimental group, and error bars indicate SEM. Image published in: Wu Y et al. (2008) Copyright: © 2008 Wu et al. Creative Commons Attribution license Larger Image Printer Friendly View |