XB-IMG-127361
Xenbase Image ID: 127361
|
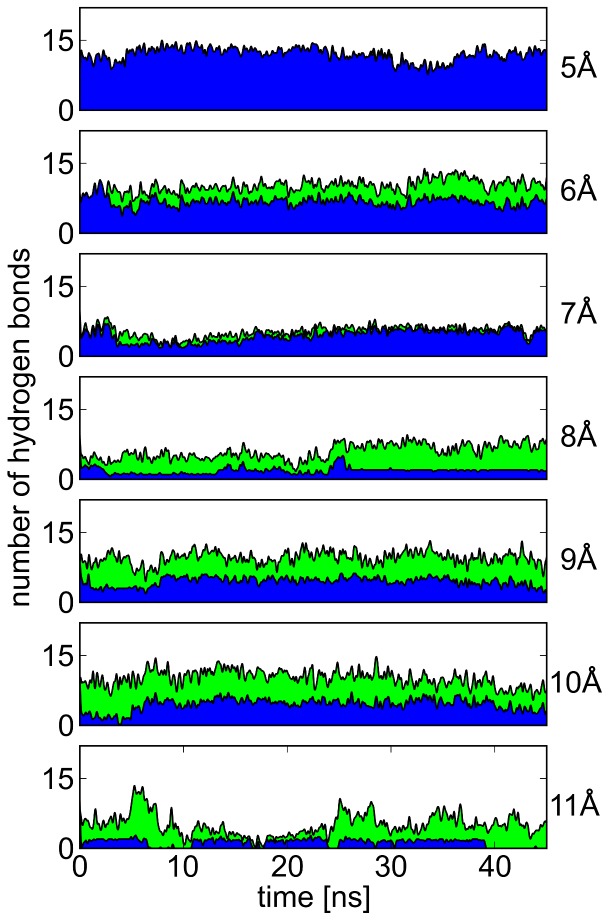
Figure 3. Hydrogen bonds formed by N629 at different S620–N629 distances.For each S620–N629 C distance (right), the number of hydrogen bonds formed by the N629 side-chain to the same subunit (blue area, mainly S620) and to neighboring subunits (green area, mainly G628) is shown over simulation time. A steady rise in the proportion of inter-subunit hydrogen bonds can be seen with an increase in S-N distance. Image published in: Köpfer DA et al. (2012) Köpfer et al. Creative Commons Attribution license Larger Image Printer Friendly View |