XB-IMG-125634
Xenbase Image ID: 125634
|
|
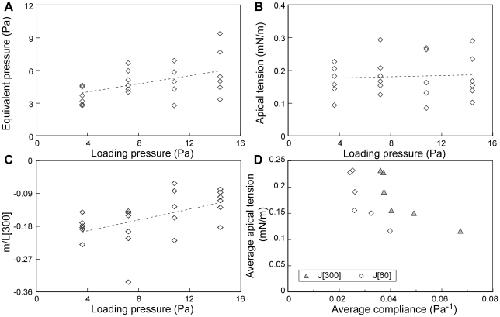
Figure 6. Comparing two models of induced contractions.Loading pressure versus magnitude of induced contractions calculated as A) equivalent pressure, B) apical tension, or C) the ratio of the maximal displacement during the contraction, ‘m’, to the pre-contraction aspirated length, L[300]. Lines for linear least squares fits are shown for clarity only. D) Average compliance for each clutch versus average apical tension for each clutch. Compliance was calculated at 60 s (J[60]) and 300 s (J[300]); n = 3 to 4 for each clutch. Image published in: von Dassow M et al. (2010) von Dassow et al. Creative Commons Attribution license Larger Image Printer Friendly View |