XB-IMG-124479
Xenbase Image ID: 124479
|
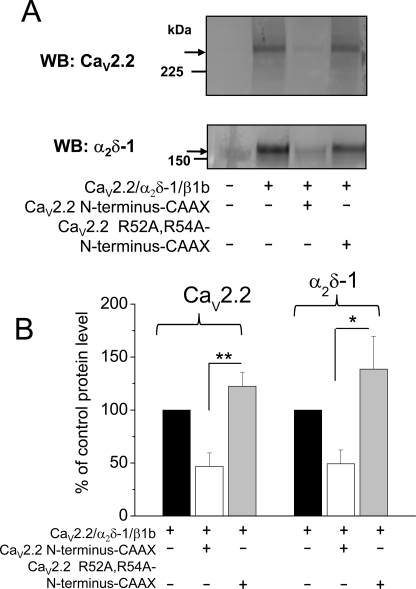
FIGURE 6. Examination of the effect of the N terminus of CaV2.2 on CaV2.2 protein expression. A, expression of CaV2.2 (upper panel) and α2δ-1 (lower panel) protein in untransfected tsA-201 cells (first lane), when CaV2.2/α2δ-1/β1b were expressed, alone (second lane) and together with CaV2.2 N terminus-CAAX (third lane), or R52A/R54A CaV2.2 N terminus-CAAX (fourth lane). The same amount of total protein was loaded for all samples on a gel, for accurate comparison among lanes. B, bar chart from quantification of results, including those in A, showing the effect of CaV2.2 N terminus-CAAX (open bars, n = 6) or R52A/R54A CaV2.2 N terminus-CAAX (gray bars, n = 4) relative to control levels (black bars), for CaV2.2 (left) and α2δ-1 (right) protein levels. The statistical significance of the differences indicated were determined by Student's t test. *, p = 0.0162; **, p = 0.0041. Error bars indicate S.E. Image published in: Page KM et al. (2010) © 2010 by The American Society for Biochemistry and Molecular Biology, Inc. Creative Commons Attribution-NonCommercial license Larger Image Printer Friendly View |