XB-IMG-122659
Xenbase Image ID: 122659
|
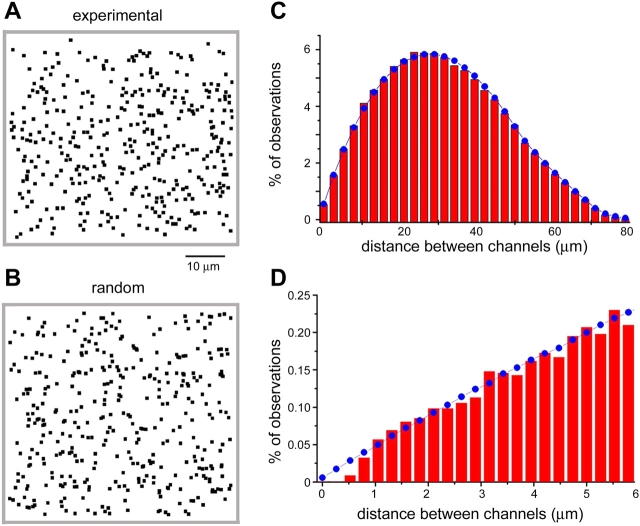
Figure 9. Muscle nicotinic AChR are randomly distributed in the oocyte membrane. (A) Representative map of nAChR channels distributed throughout a 60 × 60 μm imaging field, formed by manually plotting the locations of all (370) discrete SCCaFT sites observed during three 7-s recording periods in the presence of 30 nM ACh. (B) Example of a simulated random distribution, created by generating 370 random x-y coordinates within the same image field. (C) Histogram (red bars) shows the distribution of measured interchannel spacings. Data were obtained by calculating the separations between each channel and every other channel within the imaging field. Measurements were taken from three other membrane regions (550 × 400 pixel; 72 × 52 μm) like that illustrated in A, each of which contained 308–380 channels. The blue curve shows the distribution expected if channels with the same overall density as the experimental data were randomly arrayed. It was formed by averaging the interchannel distributions derived from 10 sets of randomly generated coordinates corresponding to each of the three experimental maps. (D) The same data as in C, replotted on an expanded scale to show the distribution of observed (red bars) and random (blue curve) interchannel spacings for spacings up to 6 μm. Image published in: Demuro A and Parker I (2005) Copyright © 2005, The Rockefeller University Press. Creative Commons Attribution-NonCommercial-ShareAlike license Larger Image Printer Friendly View |