XB-IMG-120954
Xenbase Image ID: 120954
|
|
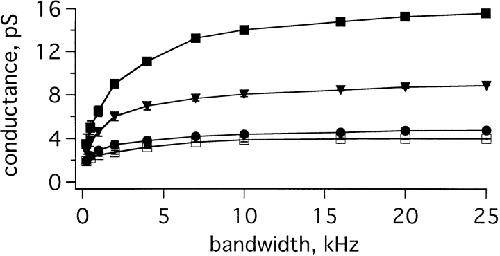
Figure 11. Calculated unitary conductances as a function of the experimental bandwidth. Curves shown for KvLQT1 channels (□), IKs channels (▪), D76N IKs channels (•), and S74L IKs channels (▾). The curves were obtained measuring the variance at 70 mV, using cut-off frequencies from 0.25 to 25 kHz, and then scaled the value of conductance determined at 25 kHz. Data were sampled at 80 kHz and digitally filtered at the indicated frequencies. Each curve represents the average of three patches. Image published in: Sesti F and Goldstein SA (1998) Image reproduced on Xenbase with permission of the publisher and the copyright holder. Creative Commons Attribution-NonCommercial-ShareAlike license Larger Image Printer Friendly View |