XB-IMG-123487
Xenbase Image ID: 123487

|
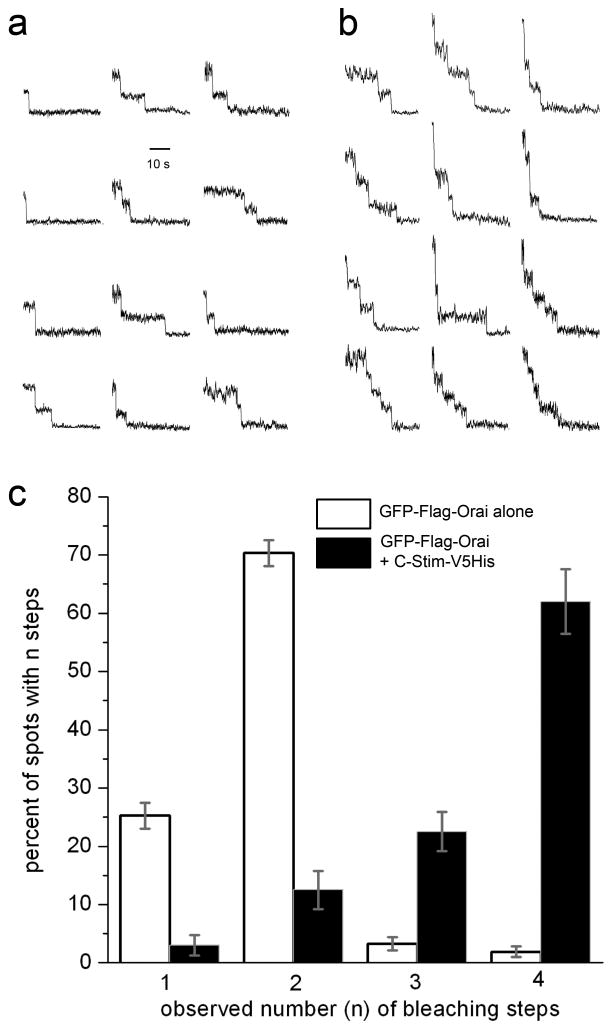
Figure 4. GFP-Orai forms dimers in the basal state and predominantly tetramers when co-expressed with C-Stima, b Representative examples of single-molecule bleaching records obtained from oocytes expressing, respectively, GFP-Orai alone and GFP-Orai together with C-Stim. c, Histogram shows percentages of spots that showed 1, 2, 3, and 4 bleaching steps in oocytes expressing GFP-Orai alone (open bars) and GFP-Orai plus C-Stim (filled bars). Errors bars indicate ± 1 SEM. Data for GFP-Orai were obtained from 400 spots, 11 imaging records, 6 oocytes; and data for GFP-Orai + C-Stim from 278 spots, 5 imaging records, 3 oocytes. Comparison of bleaching step distributions with and without C-Stim yielded a Chi square value of 590; p < 0.001. This cannot be attributed to an increased likelihood of two GFP-Orai dimers happening to lie indistinguishably close to each other because of increased expression level or C-Stim-induced clustering because fluorescence spots in both conditions showed similar random distributions and densities (respectively, 37±6 and 41±4 spots in a 40×40 μm2 region), and we did not observe spots with >4 bleaching steps as might be expected for a macro-molecular clustering. Image published in: Penna A et al. (2008) Image downloaded from an Open Access article in PubMed Central. Image reproduced on Xenbase with permission of the publisher and the copyright holder. Larger Image Printer Friendly View |
