XB-IMG-126286
Xenbase Image ID: 126286

|
|
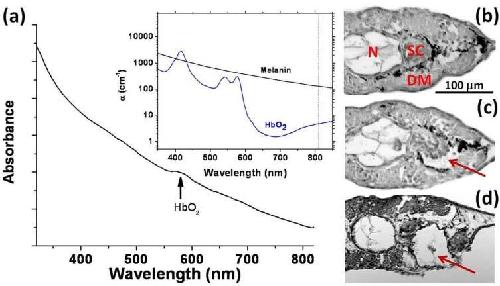
Fig. 2. (a) Absorption spectrum from a paste made of Xenopus tails and diluted in deionized water. Arrow indicates peak likely due to hemoglobin. The inset plots the absorption spectrum of melanin and oxygenated hemoglobin and the dashed line indicates the laser wavelength. (b) Histology section of undamaged tadpole tail (24 hpa) showing location of the notochord (N), the melanocytes surrounding the spinal cord (SC) and the dorsal muscle (DM). (c) Another section of the same tail where the red arrow points to absence of a melanocyte after laser treatment for one insult, i.e., shutter duration of 200ms and laser fluence of 26 mJ/cm2. (d) Section showing damage to SC and DM after multiple laser insults to melanocytes. Image published in: Mondia JP et al. (2011) ©2011 Optical Society of America. Creative Commons Attribution-NonCommercial-NoDerivatives license Larger Image Printer Friendly View |
