XB-IMG-178592
Xenbase Image ID: 178592
|
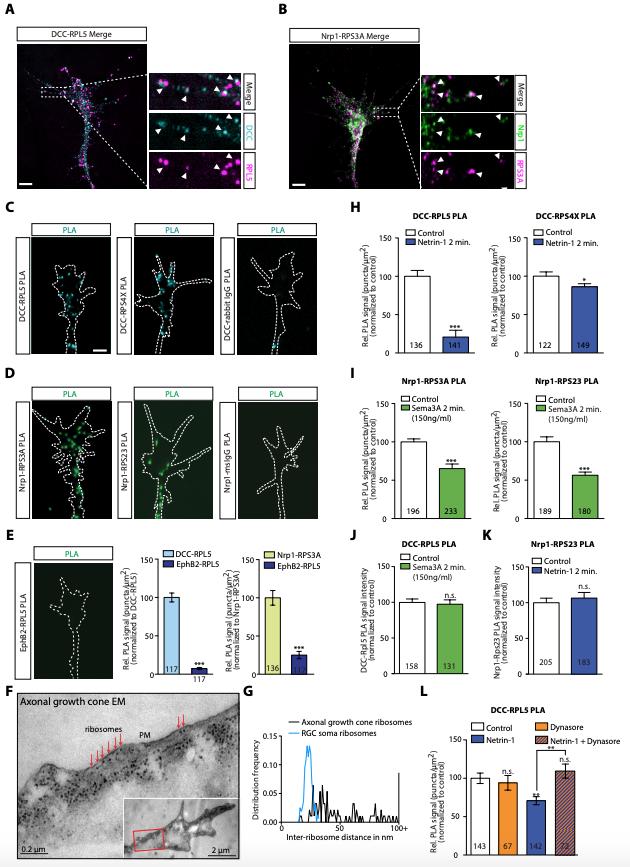
Figure 3 â Figure Supplement 1. DCC and Nrp1 are in close proximity to ribosomes in axonal growth cones in a cue-dependent manner. (A) Pearsonâs Correlation coefficients of DCC-RPL5/uL18 and Nrp1-RPS3A/eS1 from expanded axonal growth cones (data obtained from four biological replicates, bars indicate mean, error bars indicate SEM). (B) PLA images showing DCC and RPL10A/uL1 are in close proximity in axonal growth cones, whereas DCC and IgG control generates little to no PLA signal. Scale bars, 5 ïm. (C-E) EM images of an unstimulated axonal growth cone (C), a growth cone lamellipodium (D) and a retinal ganglion cell body (E). Ribosomes can be seen aligned in rows (red arrows) or isolated (white arrow) under the plasma membrane and as polysomes (blue arrows) in the cell body. (F) PLA signal between DCC and hnRNPA2B1 does not decrease after a 2 min Netrin-1 stimulation in axonal growth cones (Mann-Whitney test; bars indicate mean, error bars indicate SEM; p = 0.2886; representative PLA images are shown). (G) Sema3A stimulation at protein-synthesis independent concentration does not decrease puromycin levels in axonal growth cones (Mann-Whitney test; bars indicate mean, error bars indicate SEM; p = 0.2487; representative images are shown) or (H) PLA signal between Nrp1 and RPS3A/eS1 (Mann-Whitney test; bars indicate mean, error bars indicate SEM; p = 0.2555). For all Expansion microscopy, PLA and QIF experiments, numbers in bars indicate amount of growth cones quantified collected from at least three independent experiments. Image published in: Koppers M et al. (2019) © 2019, Koppers et al. Creative Commons Attribution license Larger Image Printer Friendly View |