XB-IMG-127844
Xenbase Image ID: 127844

|
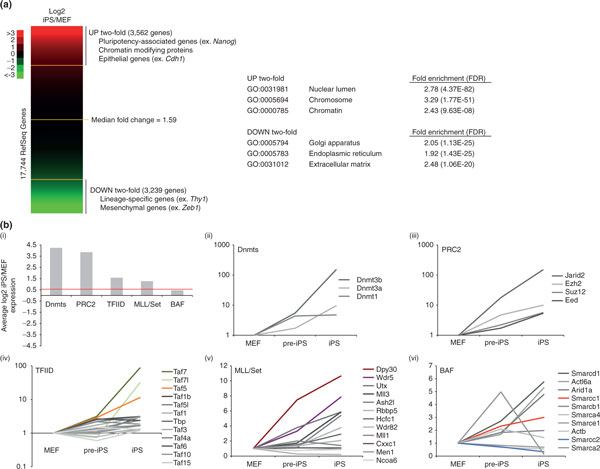
Figure 2. Characterization of gene expression changes during MEF reprogramming. (a) Gene expression data were derived from Sridharan et al. [12] and log2 induced pluripotent stem (iPS) cell/mouse embryonic fibroblast (MEF) expression ratios for all RefSeq genes ordered from highest to lowest. Shown are selected enriched gene ontology (GO) terms for genes with at least a twofold expression difference. (b) (i) Average log2 iPS cell/MEF expression ratios for selected groups of chromatin-modifying enzymes or chromatin-modifying complexes. The red line indicates overall median expression change from (a). (ii-vi) Expression changes for indicated individual complex subunits or specific enzymes between MEFs, pre-iPS cells and iPS cells, normalized to the MEF value. Pre-iPS cells represent embryonic-stem-cell-like colonies that arise during the reprogramming process but do not express pluripotency genes and can be clonally expanded. Expression changes for Taf7 (green), Taf7l (light green), Taf5 (orange), Dpy30 (maroon), Wdr5 (purple), Smarcc1 (BAF155, red) and Smarcc2 (BAF170, blue) are highlighted and discussed in the text. ex., example; Dnmt, DNA methyltransferase; FDR, false discovery rate; TFIID, transcription factor IID; MLL, mixed-lineage leukemia. Image published in: Schmidt R and Plath K (2012) Image downloaded from an Open Access article in PubMed Central. Copyright ©2012 BioMed Central Ltd. Larger Image Printer Friendly View |
