XB-IMG-125530
Xenbase Image ID: 125530
|
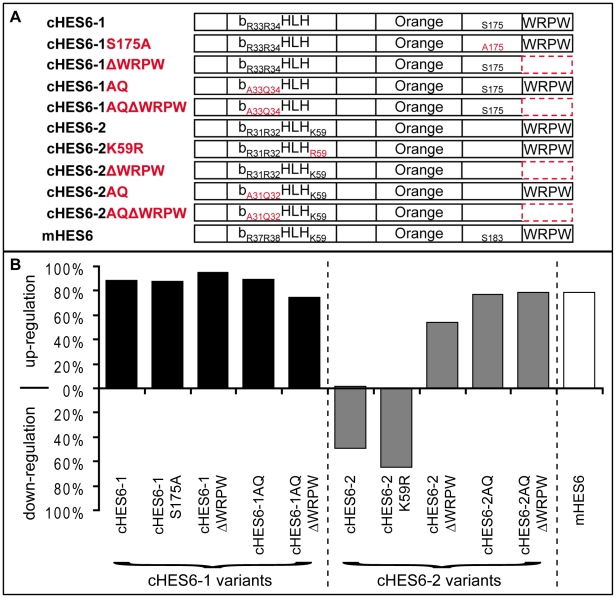
Figure 7. Phenotypical analysis of overexpressed cHES6 variants.(A) Schematic representation of various modified HES6 proteins overexpressed in the chick neural tube. Altered functional domains are depicted in red. (B) Percentage of embryos showing up- or down-regulation of cHes5-1 expression upon transfection with the different variants of cHES6-1 (black bars), cHES6-2 (grey) and mHES6 (white). Image published in: Vilas-Boas F and Henrique D (2010) Vilas-Boas, Henrique. Creative Commons Attribution license Larger Image Printer Friendly View |