XB-IMG-125535
Xenbase Image ID: 125535
|
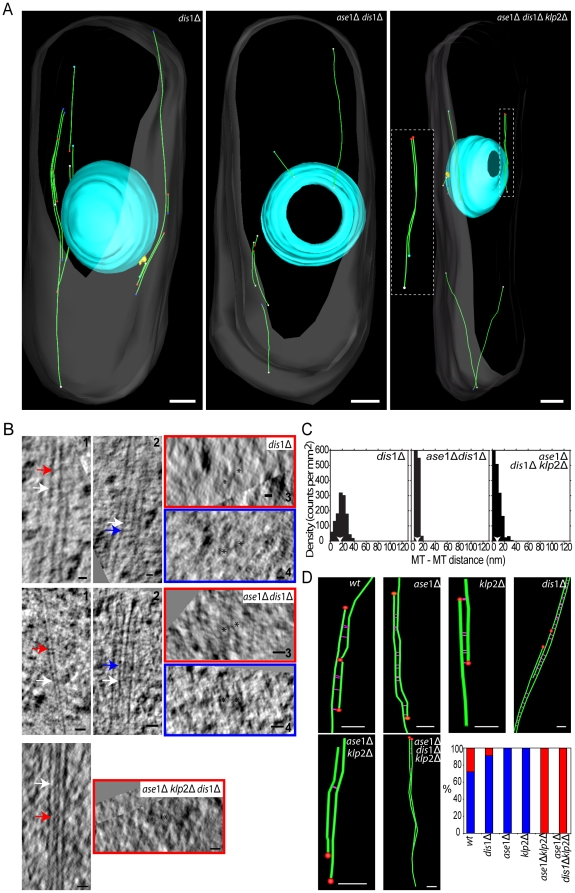
Figure 4. ase1Δ dis1Δklp2Δ cells have MT overlap regions.A. Models obtained from selected cells that are representative of each mutant cytoskeleton organization. In the triple mutant the inset shows the MT bundle of the dotted square isolated and rotated for better view. MT bundles are associated or non-associated with the SPB (yellow volume). See also Figure S1B and Movies S4–S6. B. Selected longitudinal tomographic sections of two adjacent MTs (asterisks) (1 and 2) showing electron-dense bridges (arrows). Cross-section of 1 and 2, respectively, in the plane of red and blue arrows. C. Nda analysis show a small decrease in the inter-MT distance for dis1Δ cells, while ase1Δ dis1Δ cells have a significant reduction of the inter-MT distance (arrowheads indicate the mean of the peak). D. Gallery of bundles showing inter-MT associations (100 nm stretches of MT that are at (or closer than) the higher peak values of the Nda analysis to an adjacent MT). MT minus end structure is represented by a red sphere. Percentage of anti-parallel (blue) and parallel (red) MT associations. Bars: 500 nm in A; 25 nm in B; 100 nm in D. Image published in: Roque H et al. (2010) Roque et al. Creative Commons Attribution license Larger Image Printer Friendly View |