XB-IMG-126593
Xenbase Image ID: 126593
|
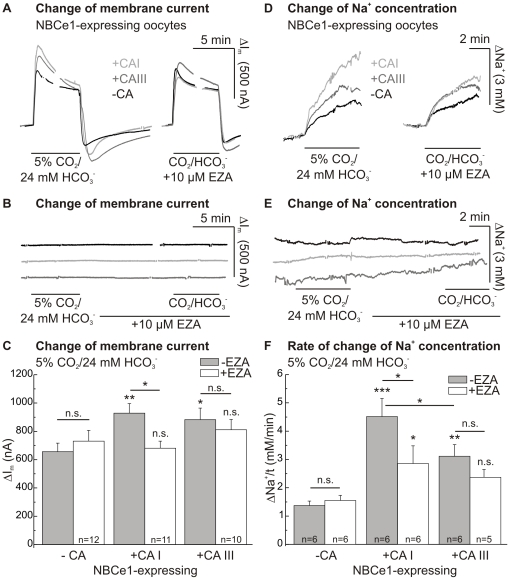
Figure 3. Effect of CAI or CAIII on NBCe1 transport activity.Original recordings (A) and statistics of the changes in membrane current (ΔIm; C) of NBCe1- and NBCe1+CAI- or NBCe1+CAIII-expressing oocytes during application of 5% CO2/24 mM HCO3−-buffered solution in the absence and presence of EZA (10 µM). Original recordings of ΔIm of CA-expressing control cells without coexpression of NBCe1 (B). By the use of Na+-selective microelectrodes the rates of rise of intracellular sodium concentration (ΔNa+/t; D, F) were obtained. Original recordings of ΔNa+/t of control cells without coexpression of NBCe1 (E). The asterisks above the bars correspond to the control cells without CA expression (−CA) before (−EZA) or during application of EZA (+EZA). Image published in: Schueler C et al. (2011) Schueler et al. Creative Commons Attribution license Larger Image Printer Friendly View |