XB-IMG-125868
Xenbase Image ID: 125868
|
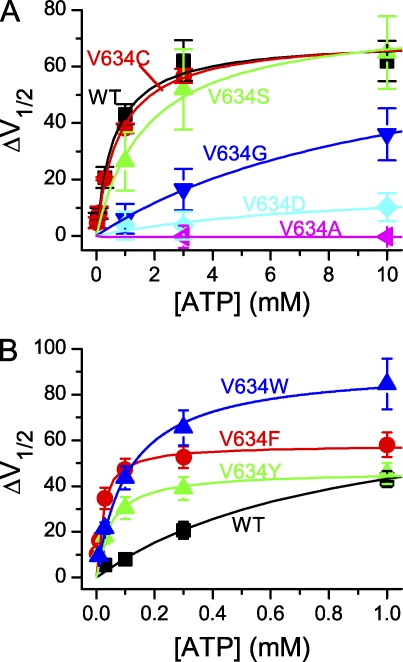
Figure 5. Shift of the V1/2 of the Poc-V curve (ΔV1/2) in various mutants of V634 as a function of the ATP concentration. Data points were fitted to Eq. 1 to determine the apparent K1/2 and V1/2,max. (A) Mutants of V634 in which the apparent ATP affinity is reduced. For comparison, the ATP dose–response curve of WT CLC-1 is also shown. (B) ATP dose-dependent curves of WT CLC-1, V634F, V634Y, and V634W. Error bars represent SEM. n = 4–8. Image published in: Tseng PY et al. (2011) © 2011 Tseng et al. Creative Commons Attribution-NonCommercial-ShareAlike license Larger Image Printer Friendly View |