XB-IMG-121237
Xenbase Image ID: 121237
|
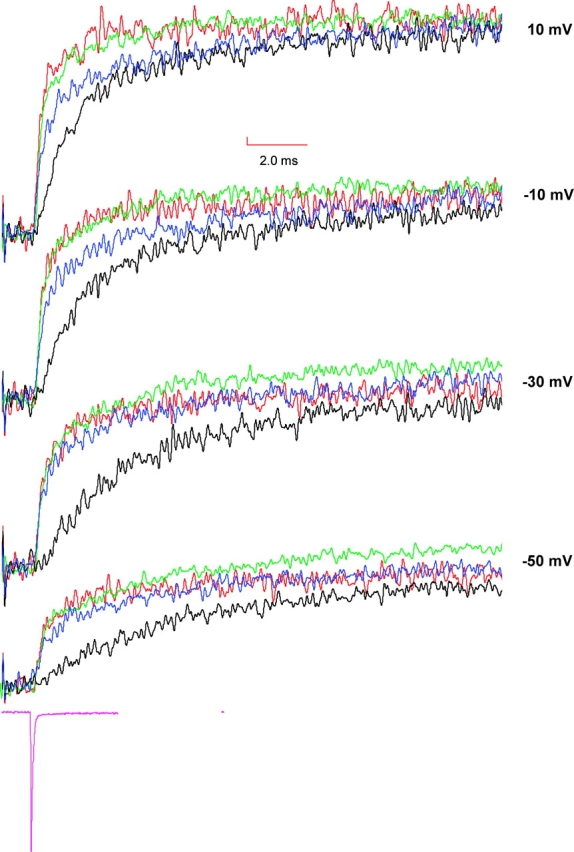
Figure 7. . Comparison of fluorescence traces obtained from S216C, S660C, L1115C, and S1436C. Fluorescence signals were recorded by pulsing to test potentials following a prepulse of 400 ms at −130 mV and are color coded in the following manner: S216C in blue, S660C in red, L1115C in green, and S1436C in black. For comparison, the fluorescence traces from various mutants were scaled to have identical steady-state amplitudes at 50 mV. For reference to the clamp speed, a representative capacity transient was obtained by pulsing to −140 mV from −130 mV (in magenta). Image published in: Chanda B and Bezanilla F (2002) Copyright © 2002, The Rockefeller University Press. Creative Commons Attribution-NonCommercial-ShareAlike license Larger Image Printer Friendly View |