XB-IMG-128091
Xenbase Image ID: 128091
|
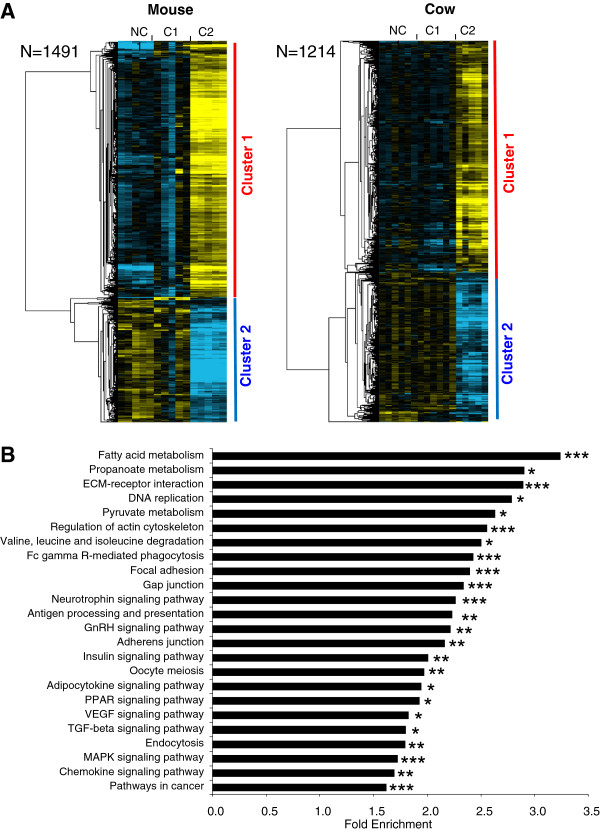
Figure 2. Differentially expressed orthologous genes exhibiting a conserved expression profile in mouse and cow. (A) Supervised clustering of expression profiles in the somatic layers of the ovarian follicle in mouse and cow species during oocyte developmental competence acquisition: developmentally incompetent or poorly competent prophase I oocytes (NC1), developmentally competent prophase I oocytes (C1), and developmentally competent metaphase II oocytes (C2). For each species, the number of differentially expressed orthologous genes is indicated. (B) Gene ontology and KEGG pathways enrichment score in clusters 1 and 2. Stars denote the p-values: * p<0.05; ** p<0.01; *** p<0.001. Image published in: Charlier C et al. (2012) Copyright ©2012 Charlier et al. Creative Commons Attribution license Larger Image Printer Friendly View |