XB-IMG-122960
Xenbase Image ID: 122960
|
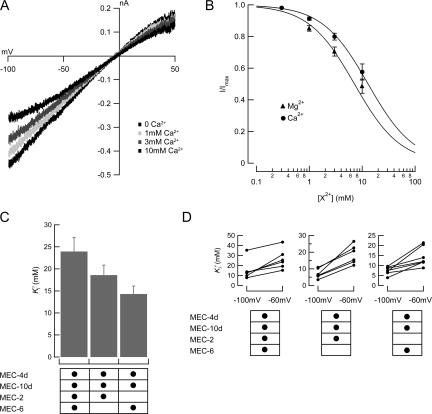
Figure 3. Block by divalent cations. (A) Macroscopic I-V curve of an outside-out patch coexpressing MEC-4d/10d, MEC-2, and MEC-6 exposed to varying Ca2+ concentrations. (B) Dose–response curves for blockade by Ca2+ and Mg2+ at −100 mV. The smooth curve is fit to the average values assuming a Hill coefficient of 1: . Measured Ki' was 12.9 mM for Ca2+, 7.0 mM for Mg2+. (C) Apparent Ca2+ inhibition constant, Ki' as a function of auxiliary subunits. Vhold = −60 mV. (D) Voltage dependence and variation of block affinity. Each line represents a single patch, with Ki' measured at −60 and −100 mV. Image published in: Brown AL et al. (2008) © 2008 Brown et al. Creative Commons Attribution-NonCommercial-ShareAlike license Larger Image Printer Friendly View |