XB-IMG-147838
Xenbase Image ID: 147838

|
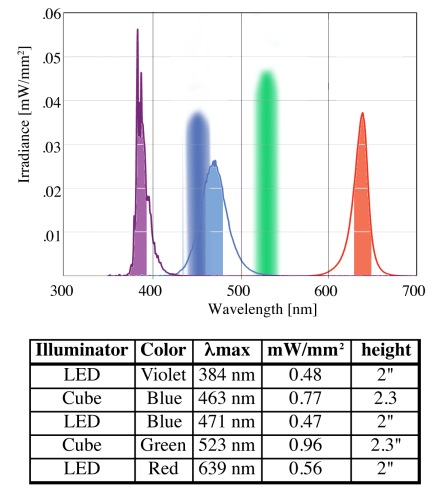
Fig. 2. Power spectra of illuminators used to activate or de-activate
channels. Two types of illumination systems were used, LED arrays and
fiberoptically delivered LED lights inside light-tight cubes. Arrays comprised
six LEDs arranged in a circle and aimed towards a central point. Irradiance
inside the cubes was measured by the manufacturer at lmax. Irradiance of
the LED arrays was measured using a USB650 spectrometer, an LS1-CAL
lamp for calibration, and SpectraSuite software. As much as possible given
the difference in thicknesses, the sensor was placed at the same distance
from the light as the embryos, as indicated in the table. To calculate irradiance,
each curve was integrated from l max – 10 nm through l max + 10 nm. Image published in: Spencer Adams D et al. (2014) Copyright © 2014. Image reproduced with permission of the Publisher, University of the Basque Country Press. Larger Image Printer Friendly View |
