XB-IMG-120290
Xenbase Image ID: 120290
|
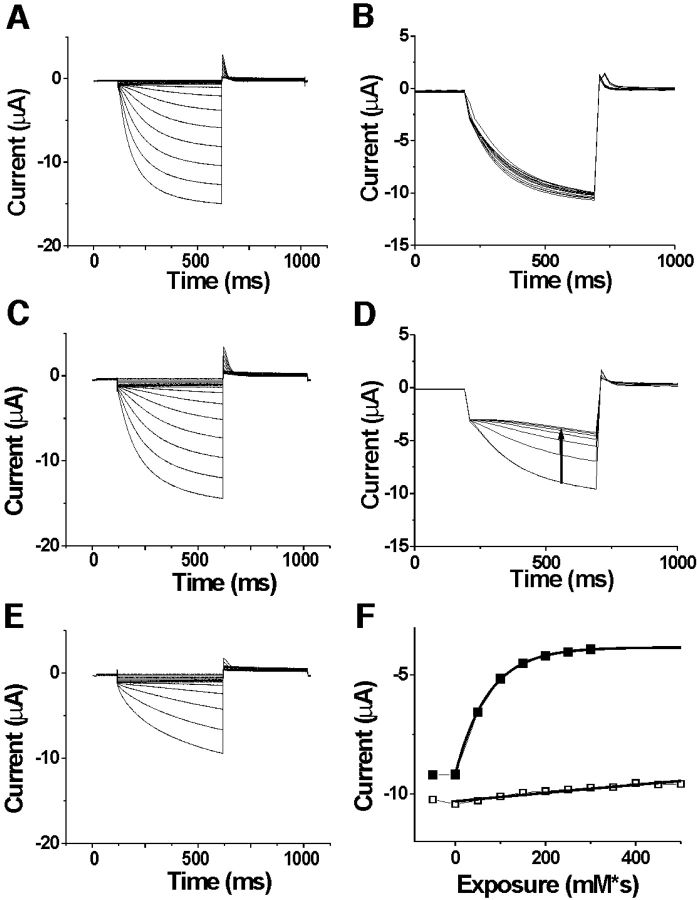
Figure 8. . Larger state-dependent modification of T249C at more hyperpolarized potentials. Currents before (A), during (B), and after (C) the application of 10 mM extracellular MTSET applied at −130 mV. Currents during (D) and after (E) the application of 10 mM extracellular MTSET applied at 0 mV on the same oocyte as in A to C. In A, C, and E, the voltage steps are in −10-mV increments from 0 to −140 mV. In B and D, the voltage was held at 0 mV and then stepped to −120 mV for the test pulse, followed by a step to +50 mV for tail currents. The holding potential was 0 mV. MTSET was applied for 5 s between each episode. (F) Currents measured at the arrow in D as a function of cumulative exposure to MTSET. The modification time course for extracellular application of MTSET at 0 mV (▪) and at −130 mV (□). The bold lines are an exponential fit to the data (for −130 mV, the I4 was constrained to the value found for the fit at 0 mV). τ = 3.5 M*s for −130 mV, and τ = 0.0727 M*s for 0 mV. Similar results were seen in four oocytes. Image published in: Vemana S et al. (2004) Copyright © 2004, The Rockefeller University Press. Creative Commons Attribution-NonCommercial-ShareAlike license Larger Image Printer Friendly View |