XB-IMG-121077
Xenbase Image ID: 121077
|
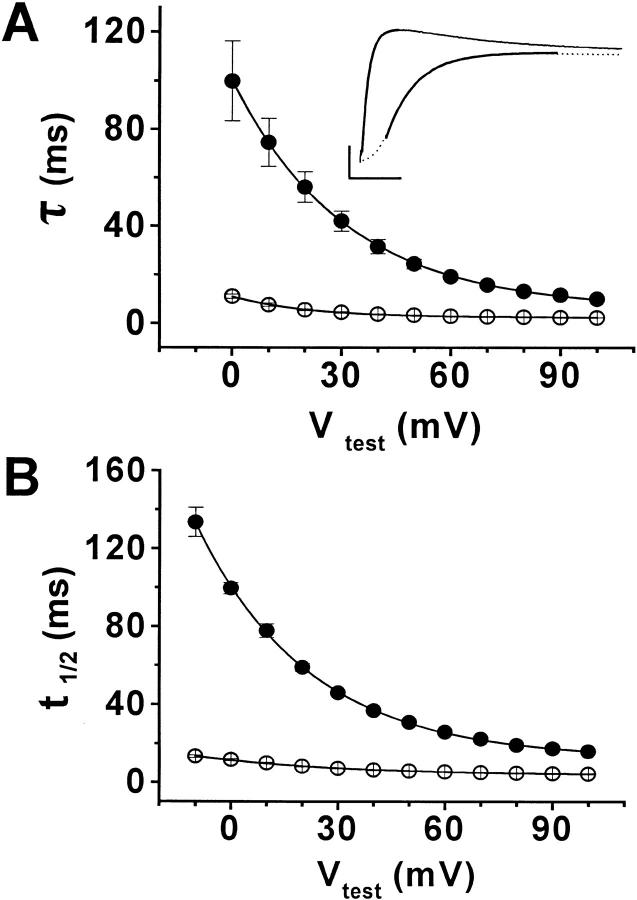
Figure 2. Mg2+ slows activation of wild-type eag. (A) Activation time constants (τ) obtained in the presence (•) or absence (○) of 10 mM Mg2+ have been plotted versus test pulse potential. Currents were evoked by depolarizing from a holding potential of −90 mV to the indicated voltages. A single exponential component was fitted to the late rising phase of ionic currents to derive τ values. Data are shown as mean ± SEM, n = 5. In this and subsequent figures, if error bars are not visible, the SEM was smaller than the size of the symbols. At 0 mV, τ = 100 ± 16.4 ms in the presence of 10 mM Mg2+, and 11.1 ± 0.9 ms in the absence of Mg2+. At +100 mV, τ = 10.0 ± 0.7 ms in the presence of 10 mM Mg2+, and 2.3 ± 0.06 ms in the absence of Mg2+. The data were fitted with single exponential functions (solid curves) to estimate values for τlim at infinite positive voltage (see text). (Inset) Fits with single exponential functions (bold curves) are shown superimposed on current traces evoked by depolarizing to +60 mV in the presence (dashed line) or absence (solid line) of 10 mM Mg2+. Bars: 2 μA and 25 ms. (B) The time to half maximal current amplitude (t1/2) at +60 mV was measured in the presence (•) or absence (○) of 10 mM Mg2+ and plotted versus test potential. Values are shown as mean ± SEM, n = 5. At 0 mV, t1/2 = 100 ± 3.0 ms in the presence of 10 mM Mg2+, and 11.6 ± 0.6 ms in the absence of Mg2+. At +100 mV, t1/2 = 15.8 ± 0.5 ms in the presence of 10 mM Mg2+, and 4.3 ± 0.2 ms in the absence of Mg2+. The data were fitted with single exponential functions (solid curves) to estimate values for t1/2lim at infinite positive voltage (see text). Image published in: Silverman WR et al. (2000) © 2000 The Rockefeller University Press. Creative Commons Attribution-NonCommercial-ShareAlike license Larger Image Printer Friendly View |