XB-IMG-122229
Xenbase Image ID: 122229
|
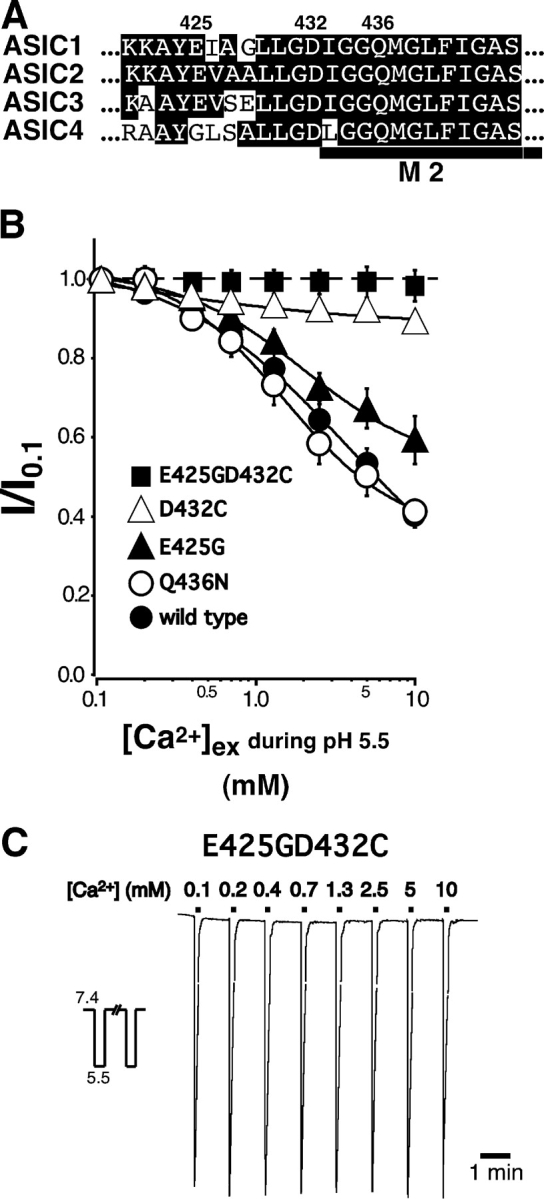
Figure 4. . Combined mutation of glutamate 425 and aspartate 432 of ASIC1a abolishes Ca2+ block. (A) Amino acid sequences of the predicted second transmembrane domain M2 of ASICs in the one-letter code. Amino acids in M2 are identical between ASIC1a and ASIC1b. The position of M2 is indicated by the bar. (B) Dose–response curves for Ca2+ block of ASIC1a channels containing the E425G, the D432C, the Q436N, or the E425GD432C substitution. Recordings were obtained using the same protocol as described for Fig. 1. Current that was blocked by 10 mM Ca2+ was 59 ± 3% (n = 12) for Q436N, 41 ± 6% (n = 12) for E425G, 11 ± 2% (n = 14) for D432C, and 2 ± 4% (n = 14–16) for E425GD432C. Lines represent a fit to a logistic function (Eq. 1) of the mean data for individual Ca2+ concentrations. Dose–response curve for Ca2+ block of ASIC1a wild type from Fig. 1 is shown for comparison. Peak current amplitudes with 0.1 mM Ca2+ were 17.9 ± 3.1 μA for Q436N, 6.5 ± 1.0 μA for E425G, 5.8 ± 0.5 μA for D432C, and 7.7 ± 1.0 μA for E425GD432C. (C) Representative trace of ASIC1aE425GD432C currents elicited by application of pH 5.5 and varying concentrations of extracellular Ca2+. The trace was obtained by averaging two original traces as described for Fig. 1 A. Duration of solution application and concentration of NaCl and CaCl2 as in Fig. 1 A. Image published in: Paukert M et al. (2004) Copyright © 2004, The Rockefeller University Press. Creative Commons Attribution-NonCommercial-ShareAlike license Larger Image Printer Friendly View |