XB-IMG-154970
Xenbase Image ID: 154970
|
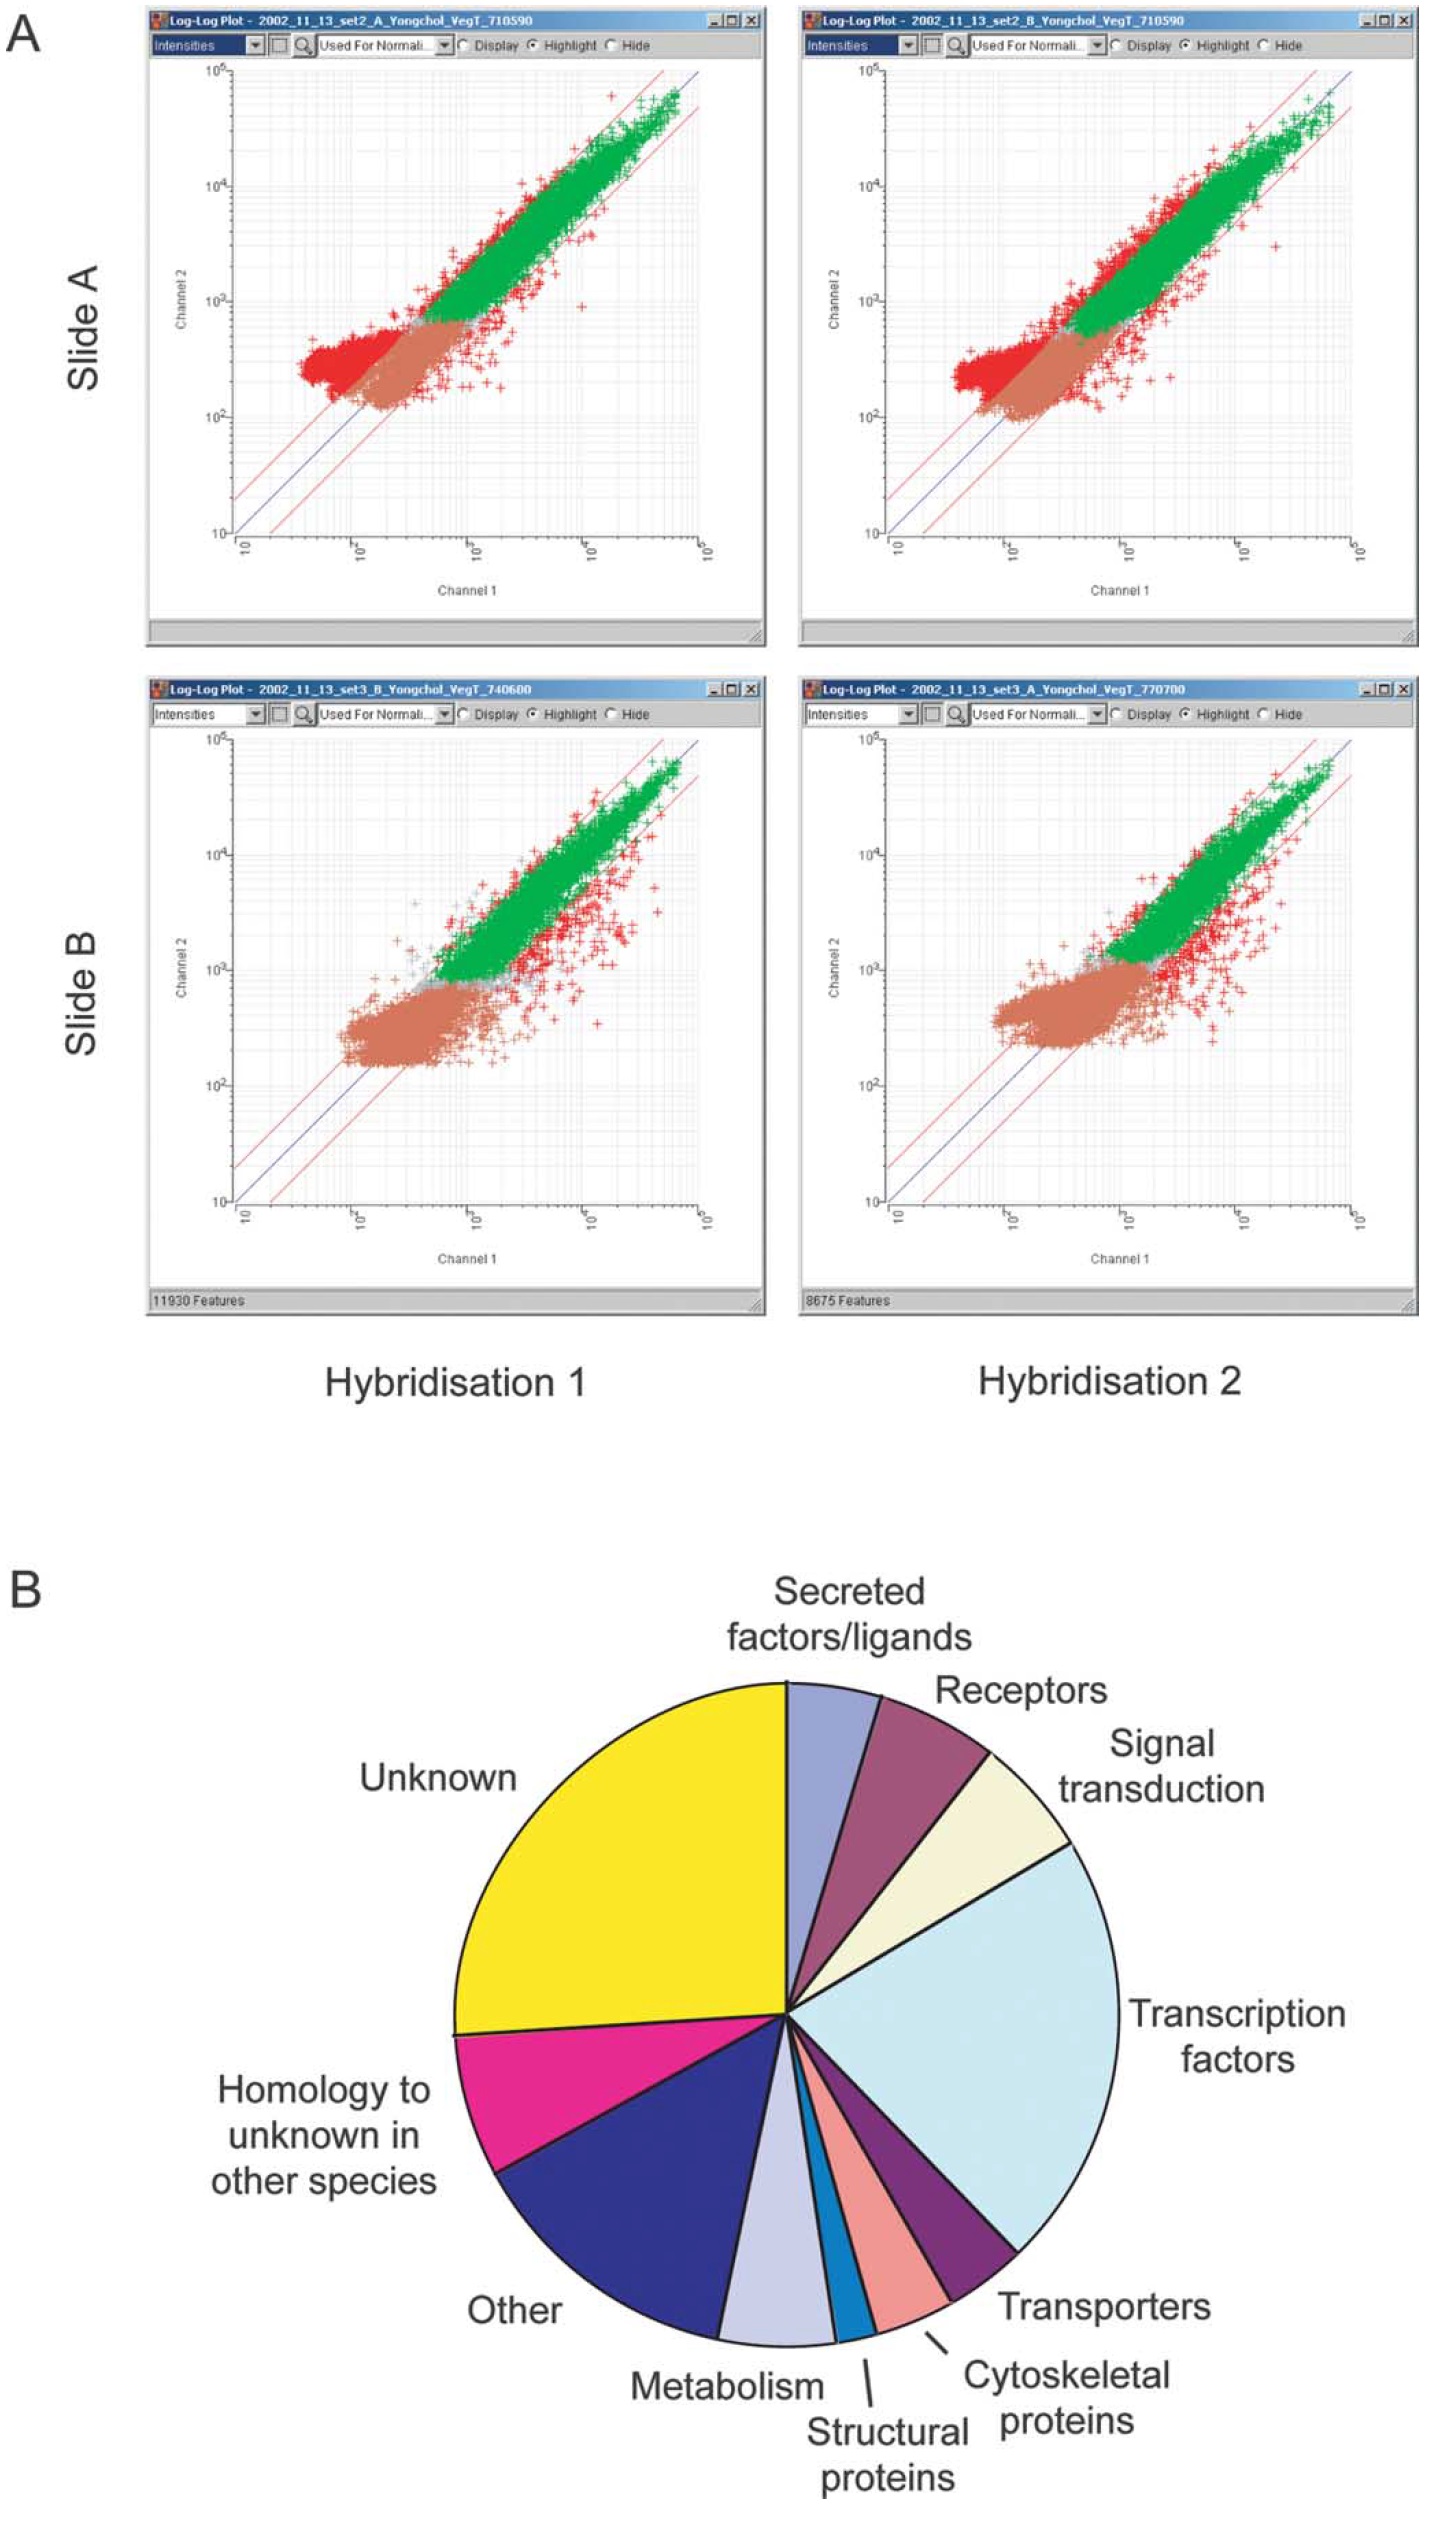
Fig. 2. Microarray analysis of VegT targets. (A) Scatter plots of Cy3 fluorescence (control animal caps; Y axis) against Cy5 fluorescence (dexamethasonetreated
caps; X axis). Pink spots were removed from further analysis because signal intensities were too low. Red spots represent genes that are differentially
expressed in response to VegT. (B) Classification by function of genes that are up-regulated by VegT. Image published in: Taverner NV et al. (2005) Copyright © 2005. Image reproduced with permission of the Publisher, Elsevier B. V. Larger Image Printer Friendly View |