XB-IMG-125264
Xenbase Image ID: 125264
|
|
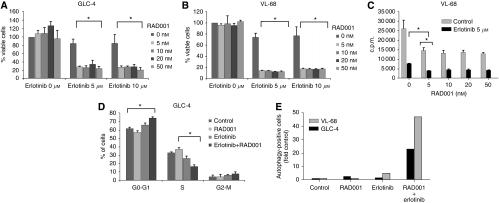
Figure 2. Effects on cell growth after treatment of SCLC cells with erlotinib, RAD001 and a combination of both. GLC-4 (A) and VL-68 (B) cells were treated with increasing doses of RAD001, erlotinib or a combination of both for 72 h and analysed for cell viability using the MTT assay. Data are given as mean percentage of viable cells±s.d. *Statistical significance (P<0.05). (C) VL-68 cells were treated with erlotinib 5 μ or increasing doses of RAD001 as indicated or a combination of both for 24 h, and thereafter were analysed using the 3H-thymidine assay. Data are given as mean counts per min±s.d. *Statistical significance (P<0.05). (D) GLC-4 cells were treated with 5 μ erlotinib, 10 n RAD001 or a combination of both for 24 h and analysed by FACS after propidium iodide staining. Data are given as mean percentage of cells±s.d. *Statistical significance (P<0.05). (E) VL-68 and GLC-4 cells were treated with 5 μ erlotinib and 100 n RAD001 or a combination of both for 48 h and analysed for acidic vesicular organelles. Data are given as x-fold autophagy-positive cells – one of three representative experiments is shown. Image published in: Schmid K et al. (2010) Copyright © 2010 Cancer Research UK. Creative Commons Attribution license Larger Image Printer Friendly View |