XB-IMG-127261
Xenbase Image ID: 127261
|
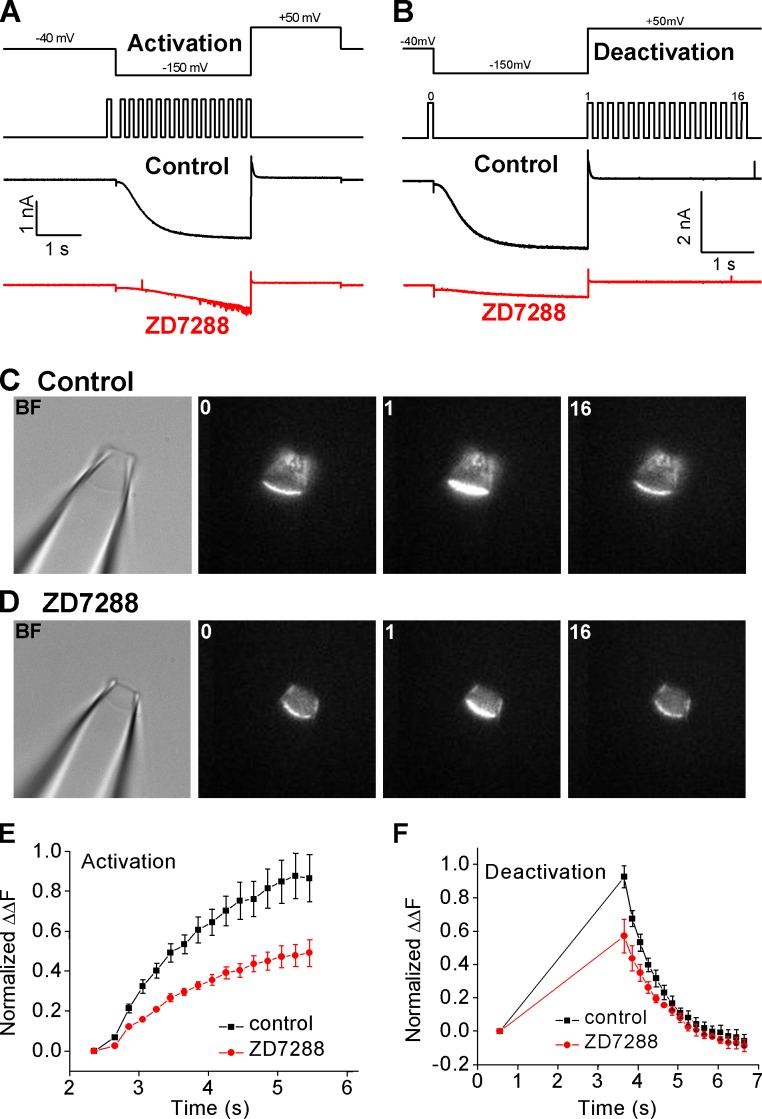
Figure 4. ZD7288 blocks ionic conductance and reduces activity-dependent cAMP binding. (A, top) Voltage protocol used for channel activation (−150 mV) and tail current recording (50 mV). (middle) Time course of image collection. (bottom) Current traces of control (black) and with 100 µM ZD7288 (red). (B) The same experimental protocol used as in A except fluorescence images were collected during channel deactivation (50 mV). (C) Brightfield (BF) image of the patch pipette and fluorescence images collected before (0), at the beginning (1), and near the end (16) of channel deactivation. Control without ZD7288. (D) Brightfield and fluorescence images collected during channel deactivation with ZD7288 added in the bath solution. (E) Normalized fluorescence intensity change during channel activation. The fluorescence intensity measured from image 0 was used as a reference. The black line indicates control; the red line indicates 100 µM ZD7288. At 5.45 s, the difference between control and ZD7288 was significant (independent samples t test: t = 2.46, P < 0.05). (F) Normalized fluorescence intensity change during channel deactivation. The black line indicates control; the red line indicates 100 µM ZD7288. At 3.65 s, the difference between control and ZD7288 was significant (independent samples t test: t = 2.96, P < 0.05). Because of photobleaching, the fluorescence intensity measured near the end of the time course was slightly lower than that at the beginning. (E and F) Error bars indicate standard error. Image published in: Wu S et al. (2012) © 2012 Wu et al. Creative Commons Attribution-NonCommercial-ShareAlike license Larger Image Printer Friendly View |