XB-IMG-169954
Xenbase Image ID: 169954
|
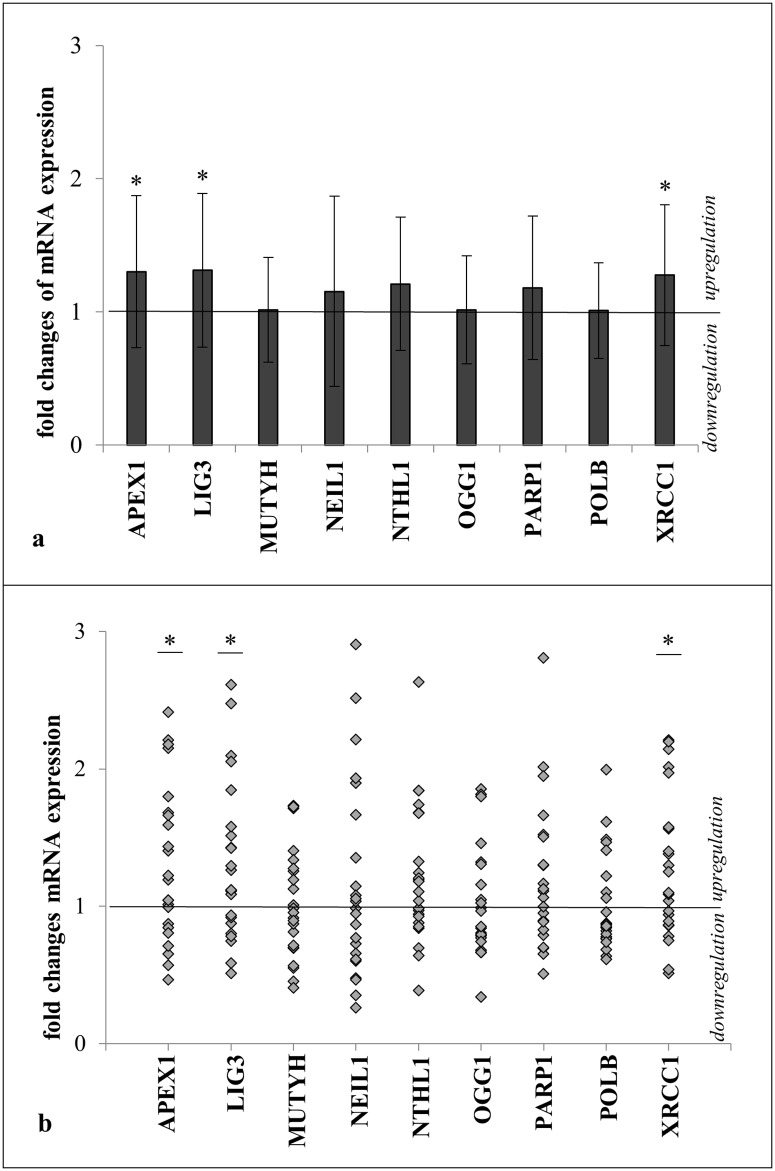
Fig 1. Fold changes of mRNA expression of DNA BER enzymes.T2DM patients with HbA1c>7.5% (n = 23) in relation to matched T2DM patients with HbA1c<7.5% (n = 23). For each pair, results were normalized to the HbA1c<7.5% expression. Matching was according to age, medication and smoking history. Significance was assumed at p<0.05 and tested with one-sample t-test against “1” or Wilcoxon test against “1” if normal distribution was not assumed. (a) Fold-changes presented as bar plots showing mean and standard deviation. (b) Distribution of fold changes. Each point represents a matching pair (n = 23). Image published in: Grindel A et al. (2016) © 2016 Grindel et al. Creative Commons Attribution license Larger Image Printer Friendly View |