XB-IMG-128960
Xenbase Image ID: 128960
|
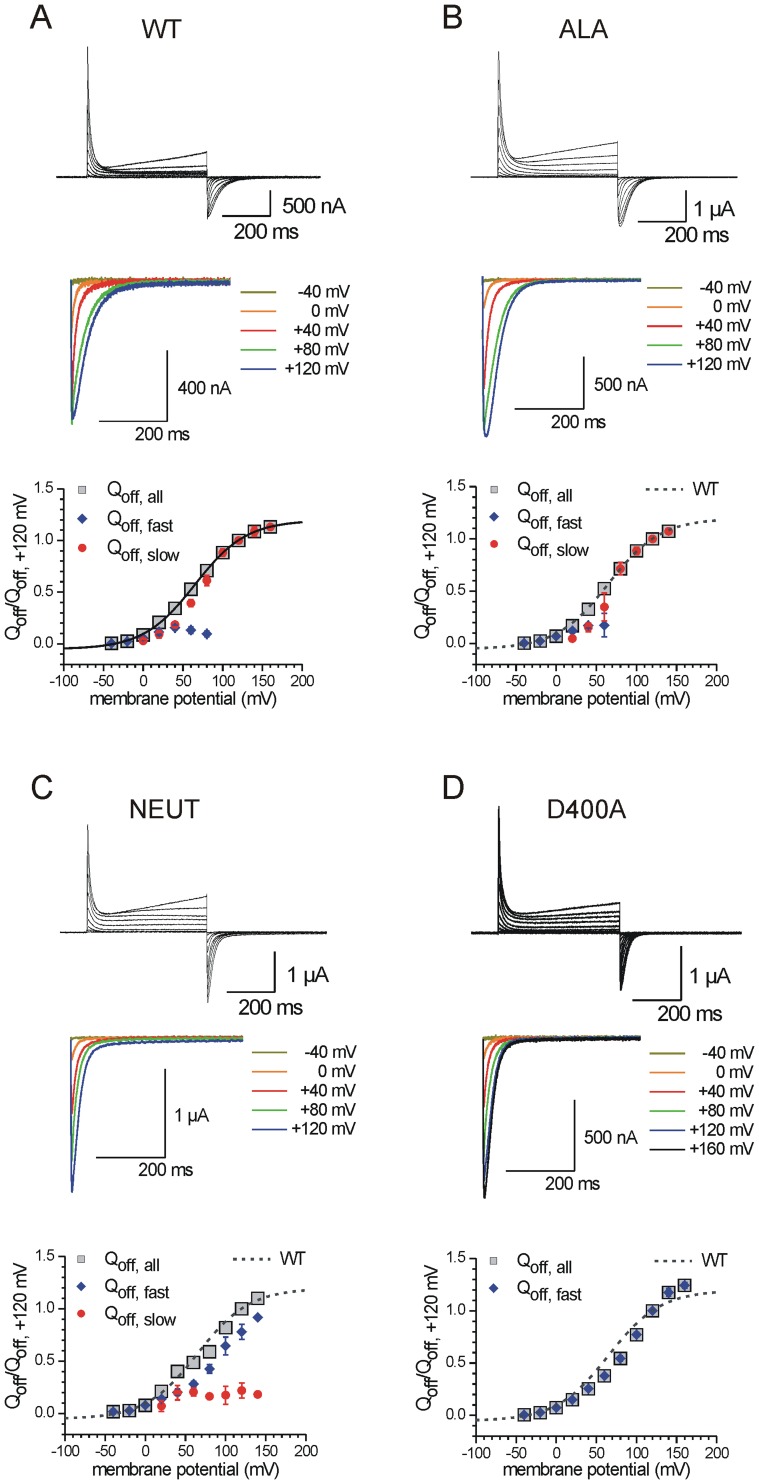
Figure 5. TI loop mutations differently affect the voltage sensor dynamics.On-sensing currents of Ci-VSP were recorded from a holding potential of −60 mV in response to variable test pulses between −40 to+160 mV at maximum (increment: 20 mV, duration: 500 ms). Off-sensing currents were monitored by stepping back to −50 mV after the test potential phase (off-pulse duration: 500 ms). (A–D) Representative full current traces are shown for the WT and the denoted mutants. From these signals, selected off-currents are zoomed out (40 mV increments). As described in Materials and Methods, Qoff,all-V-distributions were calculated by integrating the off-sensing currents. These distributions are plotted against the potential of the preceding test pulse phase. From the whole amount of translocated sensing charges (Qoff,all), the fast (Qoff,fast) and the slow (Qoff,slow) component was determined as described in Materials and Methods. All calculated Qoff-values were normalized to the Qoff,all-value corresponding to the test potential of+120 mV. Qoff,all-V-distributions were approximated with a Boltzmann-type function (see Materials and Methods). Parameters of voltage-dependence (V0.5, zq) are given in Table S3. Image published in: Hobiger K et al. (2013) Image reproduced on Xenbase with permission of the publisher and the copyright holder. Creative Commons Attribution license Larger Image Printer Friendly View |