XB-IMG-121819
Xenbase Image ID: 121819
|
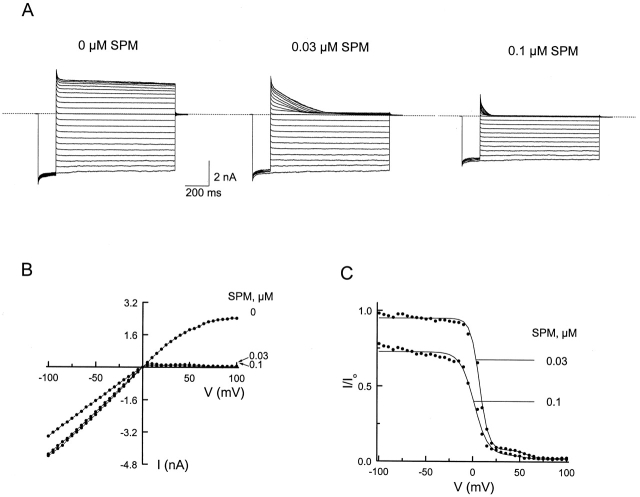
Figure 8. Channel block by intracellular spermine. (A) Current traces recorded in the absence or presence of two concentrations of spermine. The voltage protocol was as for Fig. 3, except that the voltage pulses were 1-s long. (B) I-V curves in the absence or presence of the two concentrations of spermine. (C) The fractions of current not blocked by spermine are plotted against membrane voltage. The curves superimposed on the data are fits of . For each fit, the current at a given voltage was normalized to the value at −100 mV. The parameters determined from the fits are: Ka1 = 2.3 (±0.5) × 10−7 M, Za1 = 5.4 ± 0.2; ka−2/ka−1 = 2.8 (±0.8) × 10−2, “za−1 + za−2” = 5.6 ± 0.3; Kb1 = 4.6 (±0.7) × 10−6 M, Zb1 = 3.7 ± 0.3; kb−2/kb−1 = 8.5 (±0.9) × 10−4, “zb−1 + zb−2” = 3.9 ± 0.2 (mean ± SEM, n = 9). Image published in: Guo D and Lu Z (2000) © 2000 The Rockefeller University Press. Creative Commons Attribution-NonCommercial-ShareAlike license Larger Image Printer Friendly View |