XB-IMG-127798
Xenbase Image ID: 127798
|
|
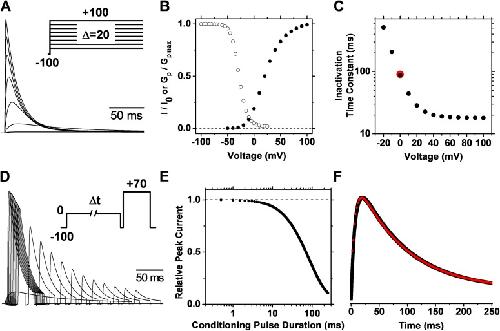
Figure 3. OSI simulation. (A) Family of outward currents evoked by a series of voltage steps (inset). (B) Normalized GP-V and steady-state inactivation curves. The simulation of steady-state inactivation assumed 10-s conditioning pulses and a test pulse of +70 mV. (C) Voltage dependence of the time constant of inactivation. Time constants were determined by fitting an exponential function to the decay phase of the simulated outward currents. For comparison, the red symbol indicates the time constant determined from the double-pulse protocol. (D) Outward currents evoked by a double-pulse protocol with a 5-ms resetting gap between the two pulses (inset). This gap eliminates a Cole–Moore effect on the test current and is not long enough to cause significant recovery from inactivation (the time constant of recovery at −100 mV is ∼2,000 ms). The conditioning pulse activated 19% of the peak conductance. (E) Kinetics of double-pulse inactivation. The simulated normalized peak current evoked by the test pulse of the protocol in D plotted against the duration of the conditioning pulse. (F) Overlay of the outward current (black) evoked by a single pulse (−100 to 0 mV) and the rate of inactivation (red) at 0 mV. The rate of inactivation is the scaled negative first derivative of the plot in E. The simulations were performed at 24°C, and the model parameters are given in Table S1. Image published in: Fineberg JD et al. (2012) © 2012 Fineberg et al. Creative Commons Attribution-NonCommercial-ShareAlike license Larger Image Printer Friendly View |