XB-IMG-82033
Xenbase Image ID: 82033
|
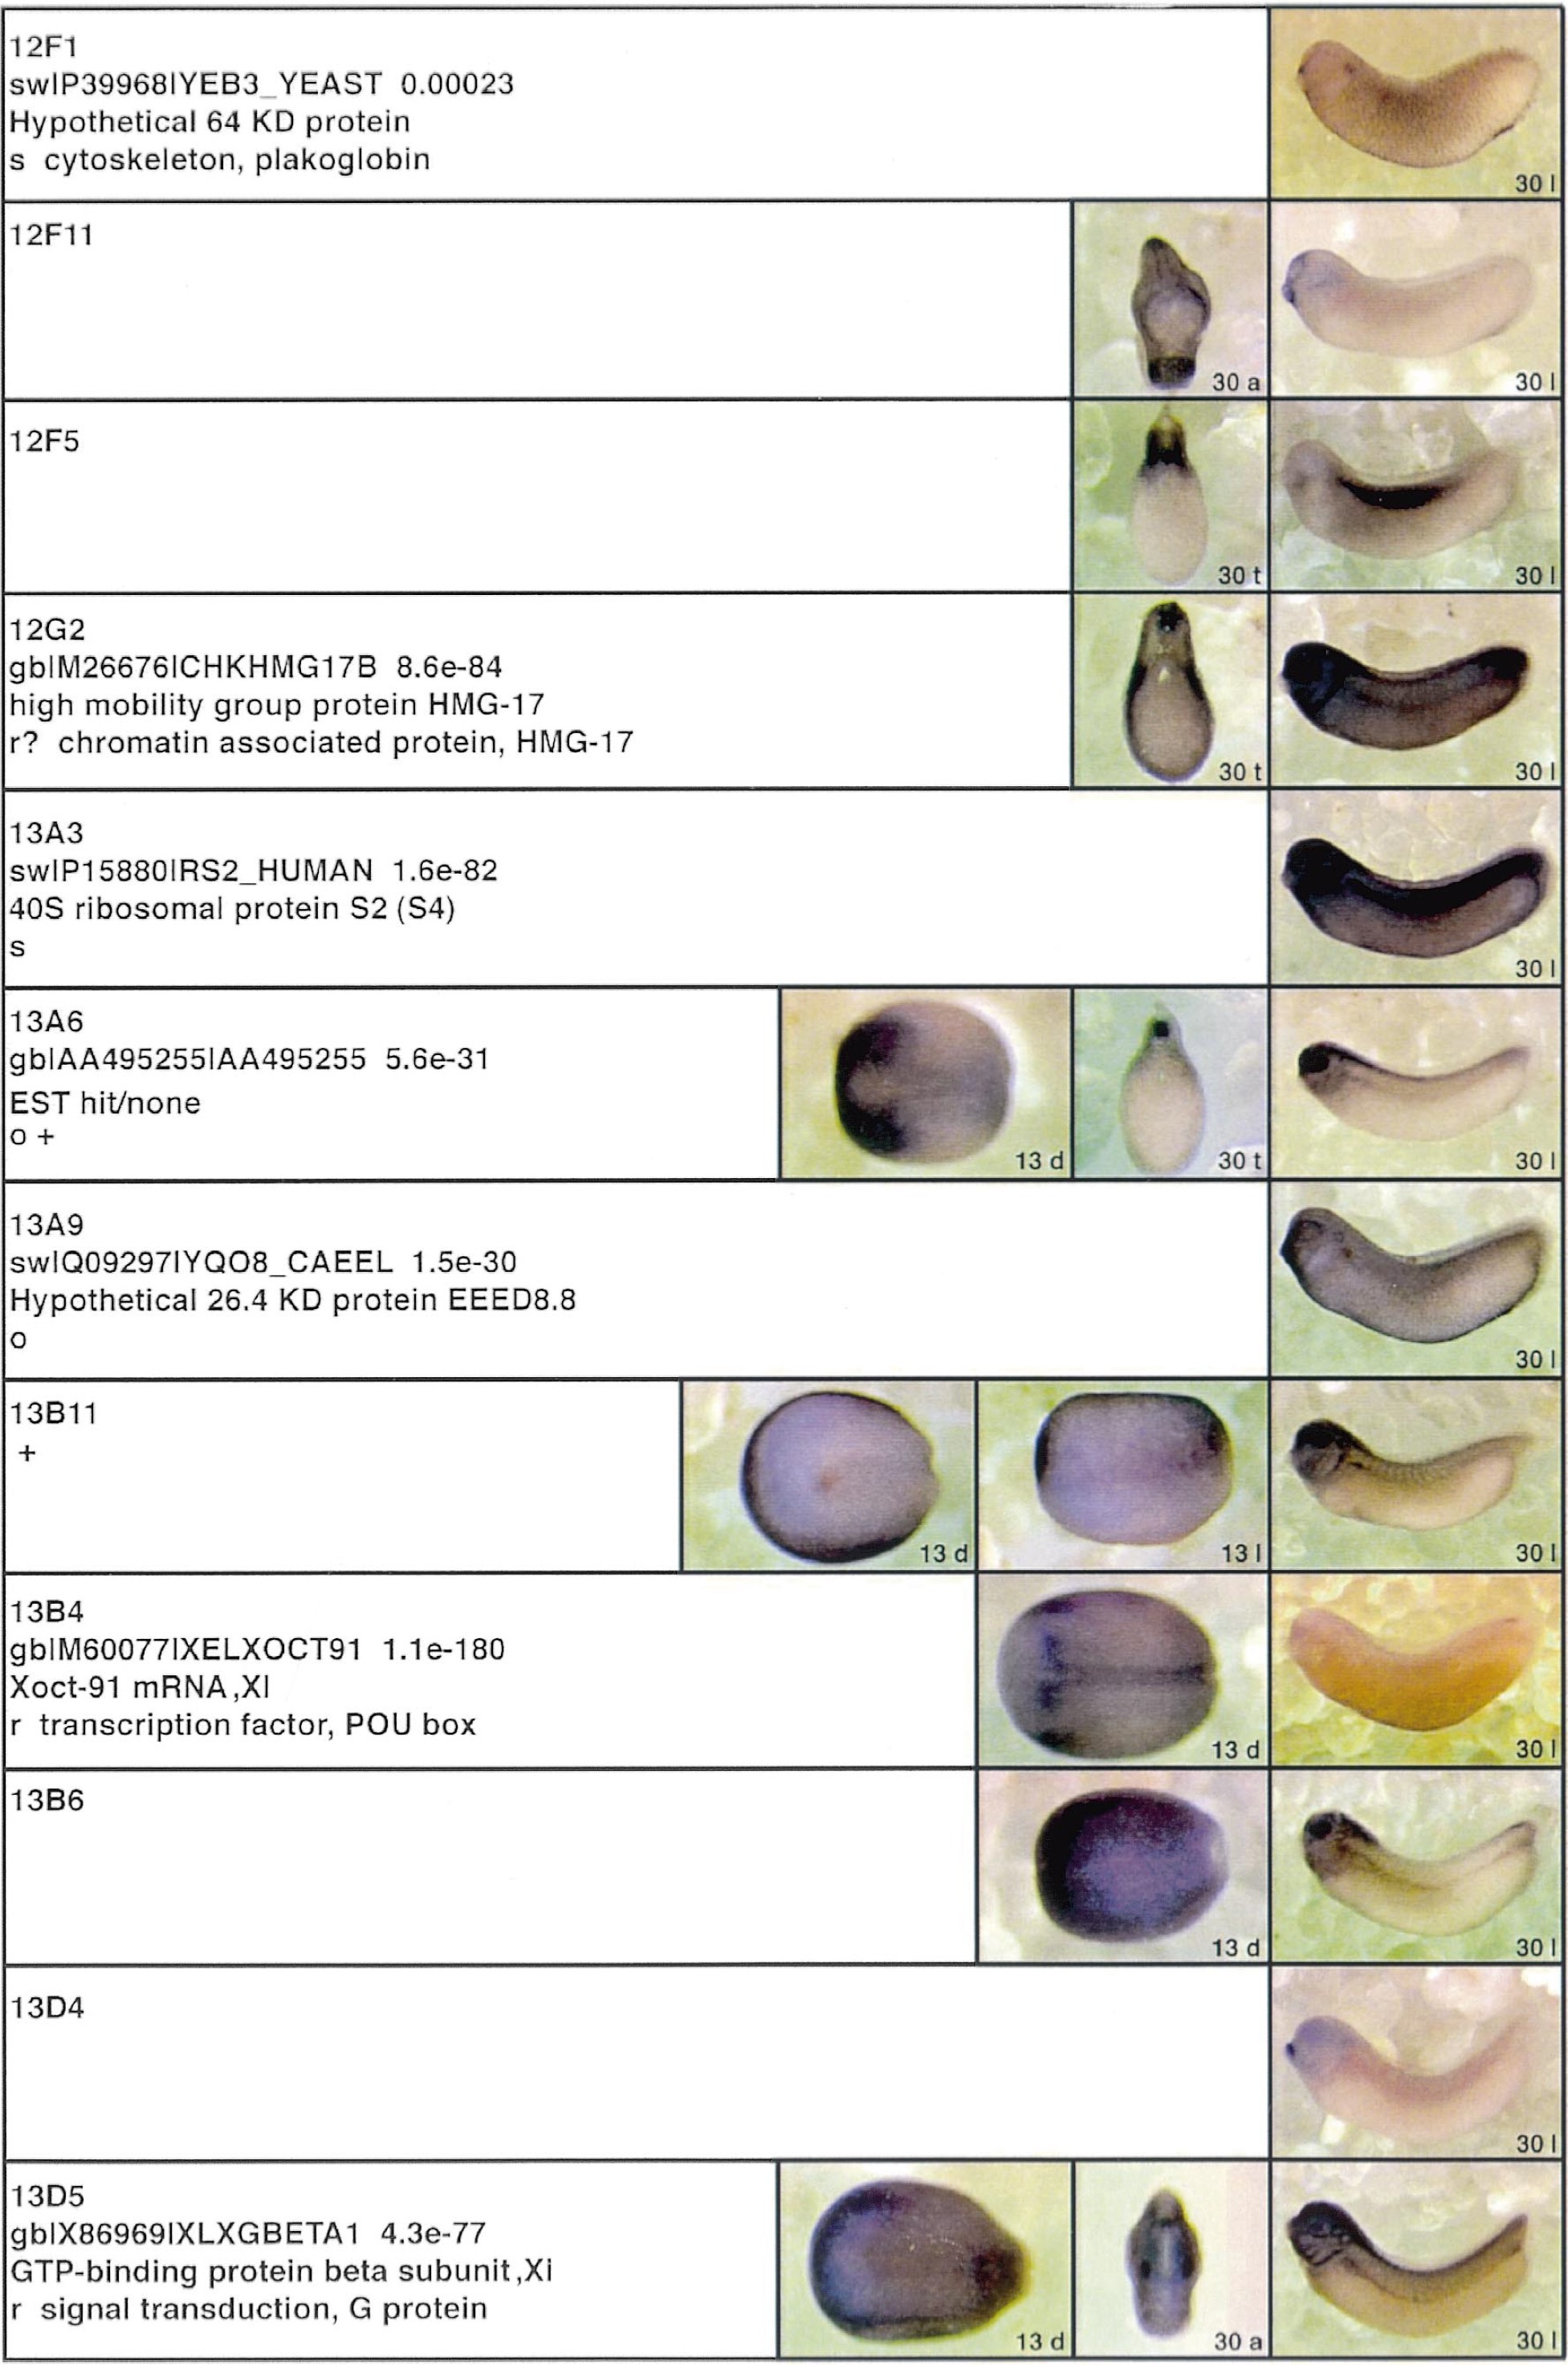
Fig. 3. Whole mount in situ hybridizations, sequence similarities and functional classifications. The left-most part represents the results of sequence similarity
searches from 273 partially sequenced cDNAs representing unique, differentially expressed genes: clone name; accession number of best hit, P-value; name
of best hit; functional classification. The order of the genes follows first digit sorting, e.g. 1, 10, 2, 20 etc. Abbreviations: o, orphan genes; m, metabolism
gene; r, developmental regulator gene; r?, housekeeping regulator gene; s, structural gene; Xl, known Xenopus gene; +, GRAIL1 good coding potential; ++,
GRAIL1 excellent coding potential. The P-value is the probability provided by the BLAST programme and calculated using Karlinltschul statistics, that
the sequence similarity is due to randomness. For EST hits, the similarities derived from the comparison of the EST or cluster of EST sequences is given. The
right-most part shows in situ hybridizations results for stages 10+, 13 and 30. Abbreviations are: a, animal view (stage 10); a, anterior view (stage 30); d,
dorsal view; l, lateral view; p, posterior view; s, sagittal section; t, transverse section; v, vegetal view (stage 10); v, ventral view (stage 30).
page 8 Image published in: Gawantka V et al. (1998) Copyright © 1998. Image reproduced with permission of the Publisher, Elsevier B. V.
Image source: Published Larger Image Printer Friendly View |