XB-IMG-121117
Xenbase Image ID: 121117
|
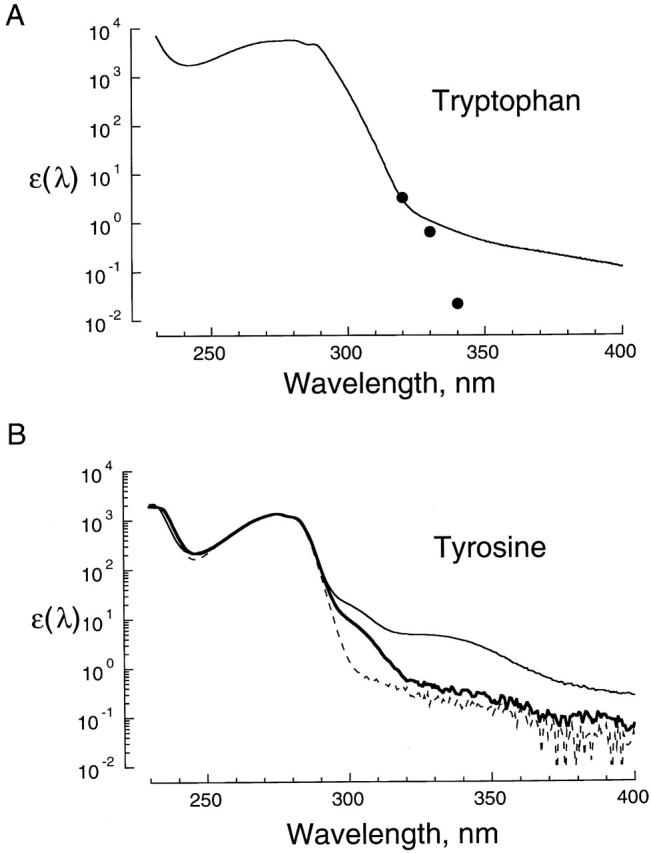
Figure 2. Removal of scattering and contaminant artifacts from tryptophan and tyrosine absorption spectra. (A) Absorption spectrum of tryptophan in standard sodium solution at pH 7.6. The solid trace is the spectrum of 312 μM tryptophan from 225 to 310 nm spliced onto that of 27 mM tryptophan from 310 to 400 nm. The extinction coefficient (M−1 · cm−1) was computed from the absorbance using Beer's law (), and is plotted as a function of wavelength in nanometers on semi-logarithmic coordinates. Also shown is the fluorescence excitation spectrum of 42 mM tryptophan from 320 to 340 nm (•) scaled to match the absorption spectrum at 320 nm. The emission wavelength for the fluorescence excitation spectrum was 360 nm. (B) Absorption spectra of tyrosine and related compounds in aqueous solution. The extinction coefficients of tyrosine (143 μM, thin line) and the dipeptide Tyr-Ala (129 μM, bold line) in standard sodium solution, pH 7.6, are plotted as a function of wavelength on semi-logarithmic axes. Also shown is the spectrum of Tyr-Ala (129 μM, dashed line) in the same solvent at pH 5.6. The Tyr-Ala spectra were scaled to the same amplitude as the tyrosine spectrum at 275.6 nm to facilitate comparison. Image published in: Middendorf TR et al. (2000) © 2000 The Rockefeller University Press. Creative Commons Attribution-NonCommercial-ShareAlike license Larger Image Printer Friendly View |