XB-IMG-174410
Xenbase Image ID: 174410
|
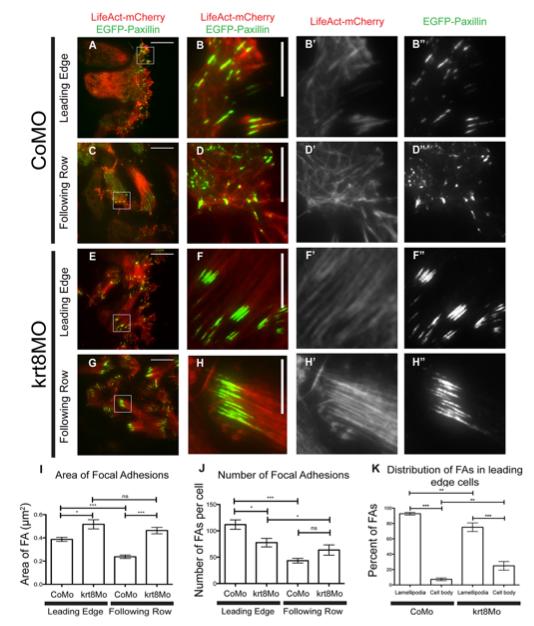
Fig. 3. Focal adhesion dynamics and actin cytoskeleton are altered in krt8 morphant explants. (A,C,E,G) Representative TIRF images of mesendoderm explants expressing LifeAct- mCherry (red) and EGFP-paxillin (green). (B-Bâ²â²,D- Dâ²â²,F-Fâ²â²,H-Hâ²â²) Magnified views of the boxes in A, C, E and G, corresponding to merged (B,D,F,H) and separate LifeAct-mCherry (Bâ²,Dâ²,Fâ²,Hâ²) and EGFP- paxillin (Bâ²â²,Dâ²â²,Fâ²â²,Hâ²â²) channels. (I-K) Quantifications of FA area (I), FAs per cell (J) and distribution of FAs within cells (K), calculated from the first frames of nine movies for each condition (Movies 3-6) (nine individual explants per condition were imaged across three separate experiments; data are mean±s.e.m. *P<0.05; **P<0.01; ***P<0.001; ns, not significant). Scale bars: 25 μm in A, C, E and G; 10 μm in B, D, F and H. Image published in: Sonavane PR et al. (2017) Copyright © 2017. Image reproduced with permission of the Publisher and the copyright holder. This is an Open Access article distributed under the terms of the Creative Commons Attribution License. Larger Image Printer Friendly View |