XB-IMG-127773
Xenbase Image ID: 127773
|
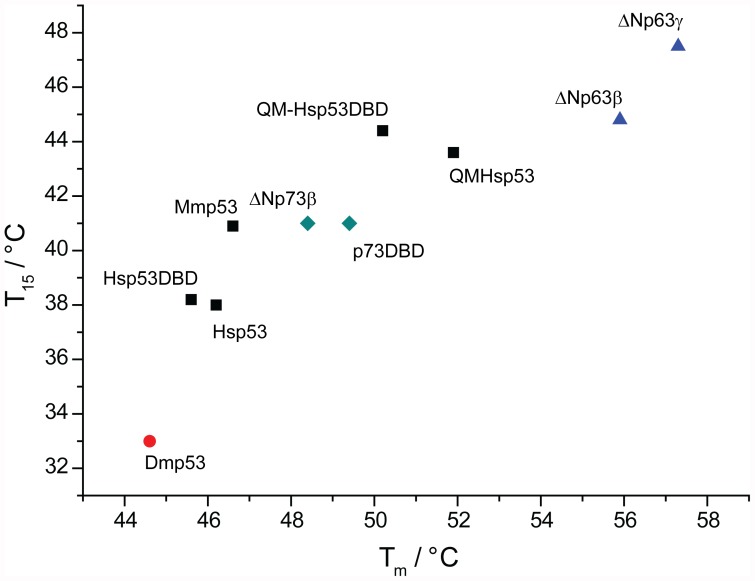
Figure 6. Correlation between kinetic (T15, unfolding of DBD) and thermodynamic (Tm, DSF) stability data.Mammalian p53 proteins studied are represented by black squares, human p63 isoforms by blue triangles, human p73 constructs by green diamonds and Dmp53 by a red circle. Image published in: Brandt T et al. (2012) Image downloaded from an Open Access article in PubMed Central. Image reproduced on Xenbase with permission of the publisher and the copyright holder. Larger Image Printer Friendly View |