XB-IMG-125791
Xenbase Image ID: 125791
|
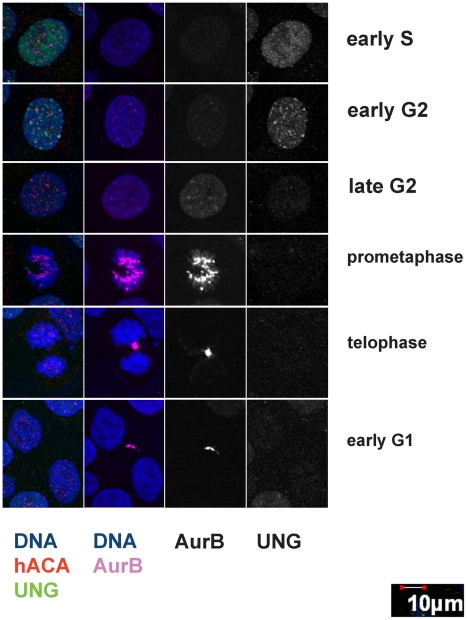
Figure 7. Cell cycle staging of UNG2 localization during G2 using indirect immunofluorescence.Example images from high-resolution confocal imaging using four channels. Left column, DNA was detected with DAPI (blue), endogenous CENP-A with ACA (red), and endogenous UNG2 with PU59 (green). Second column from the left, Aurora B was detected with Cy5 (pink) shown here with DNA (blue). Aurora B and UNG2 channels are shown alone in grayscale for clarity. Note the presence of Aurora B in the second row, indicating that UNG2 foci resembling centromeres are prominent during early G2. Image published in: Zeitlin SG et al. (2011) Zeitlin et al. Creative Commons Attribution license Larger Image Printer Friendly View |