XB-IMG-125234
Xenbase Image ID: 125234
|
|
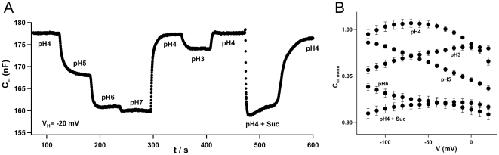
Figure 2. Capacitance changes in response to varying proton concentrations.A) Continuous recording of Cm at −20 mV and indicated pH values. When exchanging the bath solution by stepwise decreasing proton concentrations from pH 4 to 7 in the absence of sucrose, Cm decreased reversibly. Increasing the proton concentration from pH 4 to 3 at −20 mV led to a decrease of Cm as well. Subsequent application of saturating sucrose concentrations decreased Cm to similar levels as in the presence of neutral buffers. B) Cm/voltage plot at various pH values without sucrose and at pH 4 in the presence of sucrose. Decreasing the proton concentration resulted in a shift of the Cm peak towards more negative membrane potentials. At pH 4 and in the presence of saturating sucrose concentrations Cm was depressed at all voltages tested (n≥5, ±SD). Cm values were normalized to values at pH 4 in the absence of sucrose. Image published in: Carpaneto A et al. (2010) Carpaneto et al. Creative Commons Attribution license Larger Image Printer Friendly View |