XB-IMG-126904
Xenbase Image ID: 126904

|
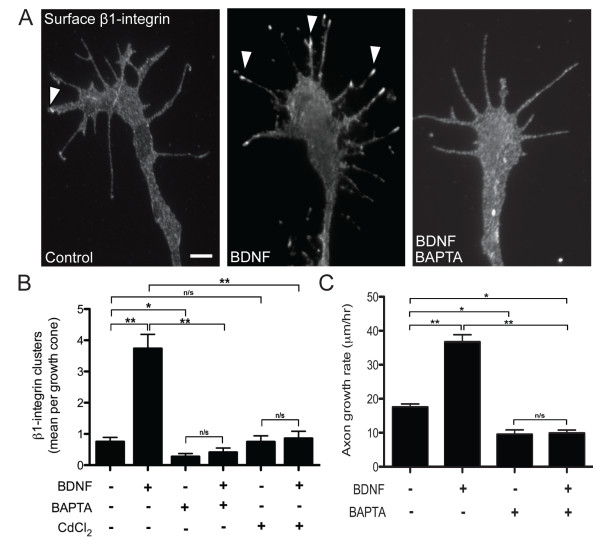
Figure 5. BDNF-induced β1-integrin clustering and stimulated axon outgrowth is Ca2+-dependent. (A) Representative immunolabeled growth cones showing the distribution of surface β1-integrin after treatments with vehicle (BSA), BDNF (50 ng/mL), or BAPTA-AM (1 μM; 30 nM [Ca2+]e) plus BDNF. Arrowheads denote β1-integrin clustering. Scale bar, 5 μm. (B) Quantification of β1-integrin clustering according to treatments with vehicle (BSA), BDNF (50 ng/mL), BAPTA-AM (1 μM; 30 nM [Ca2+]e) alone, BAPTA-AM (1 μM; 30 nM [Ca2+]e) plus BDNF, CdCl2 (50 μM; 20 min) alone, and CdCl2 plus BDNF. (C) Quantification of the mean axon growth rate after treatments with vehicle (BSA), BDNF (50 ng/mL), BAPTA-AM (1 μM; 30 nM [Ca2+]e), and BAPTA-AM (1 μM; 30 nM [Ca2+]e) plus BDNF. Data are the mean ± standard error of the mean. (n > 100, *P < 0.05, **P < 0.001, ANOVA with Tukey's post hoc analysis.) BDNF: brain-derived neurotrophic factor; BSA: bovine serum albumin; [Ca2+]e: extracellular Ca2+ concentration. Image published in: Carlstrom LP et al. (2011) Copyright ©2011 Carlstrom et al; licensee BioMed Central Ltd. Creative Commons Attribution license Larger Image Printer Friendly View |
