XB-IMG-138121
Xenbase Image ID: 138121
|
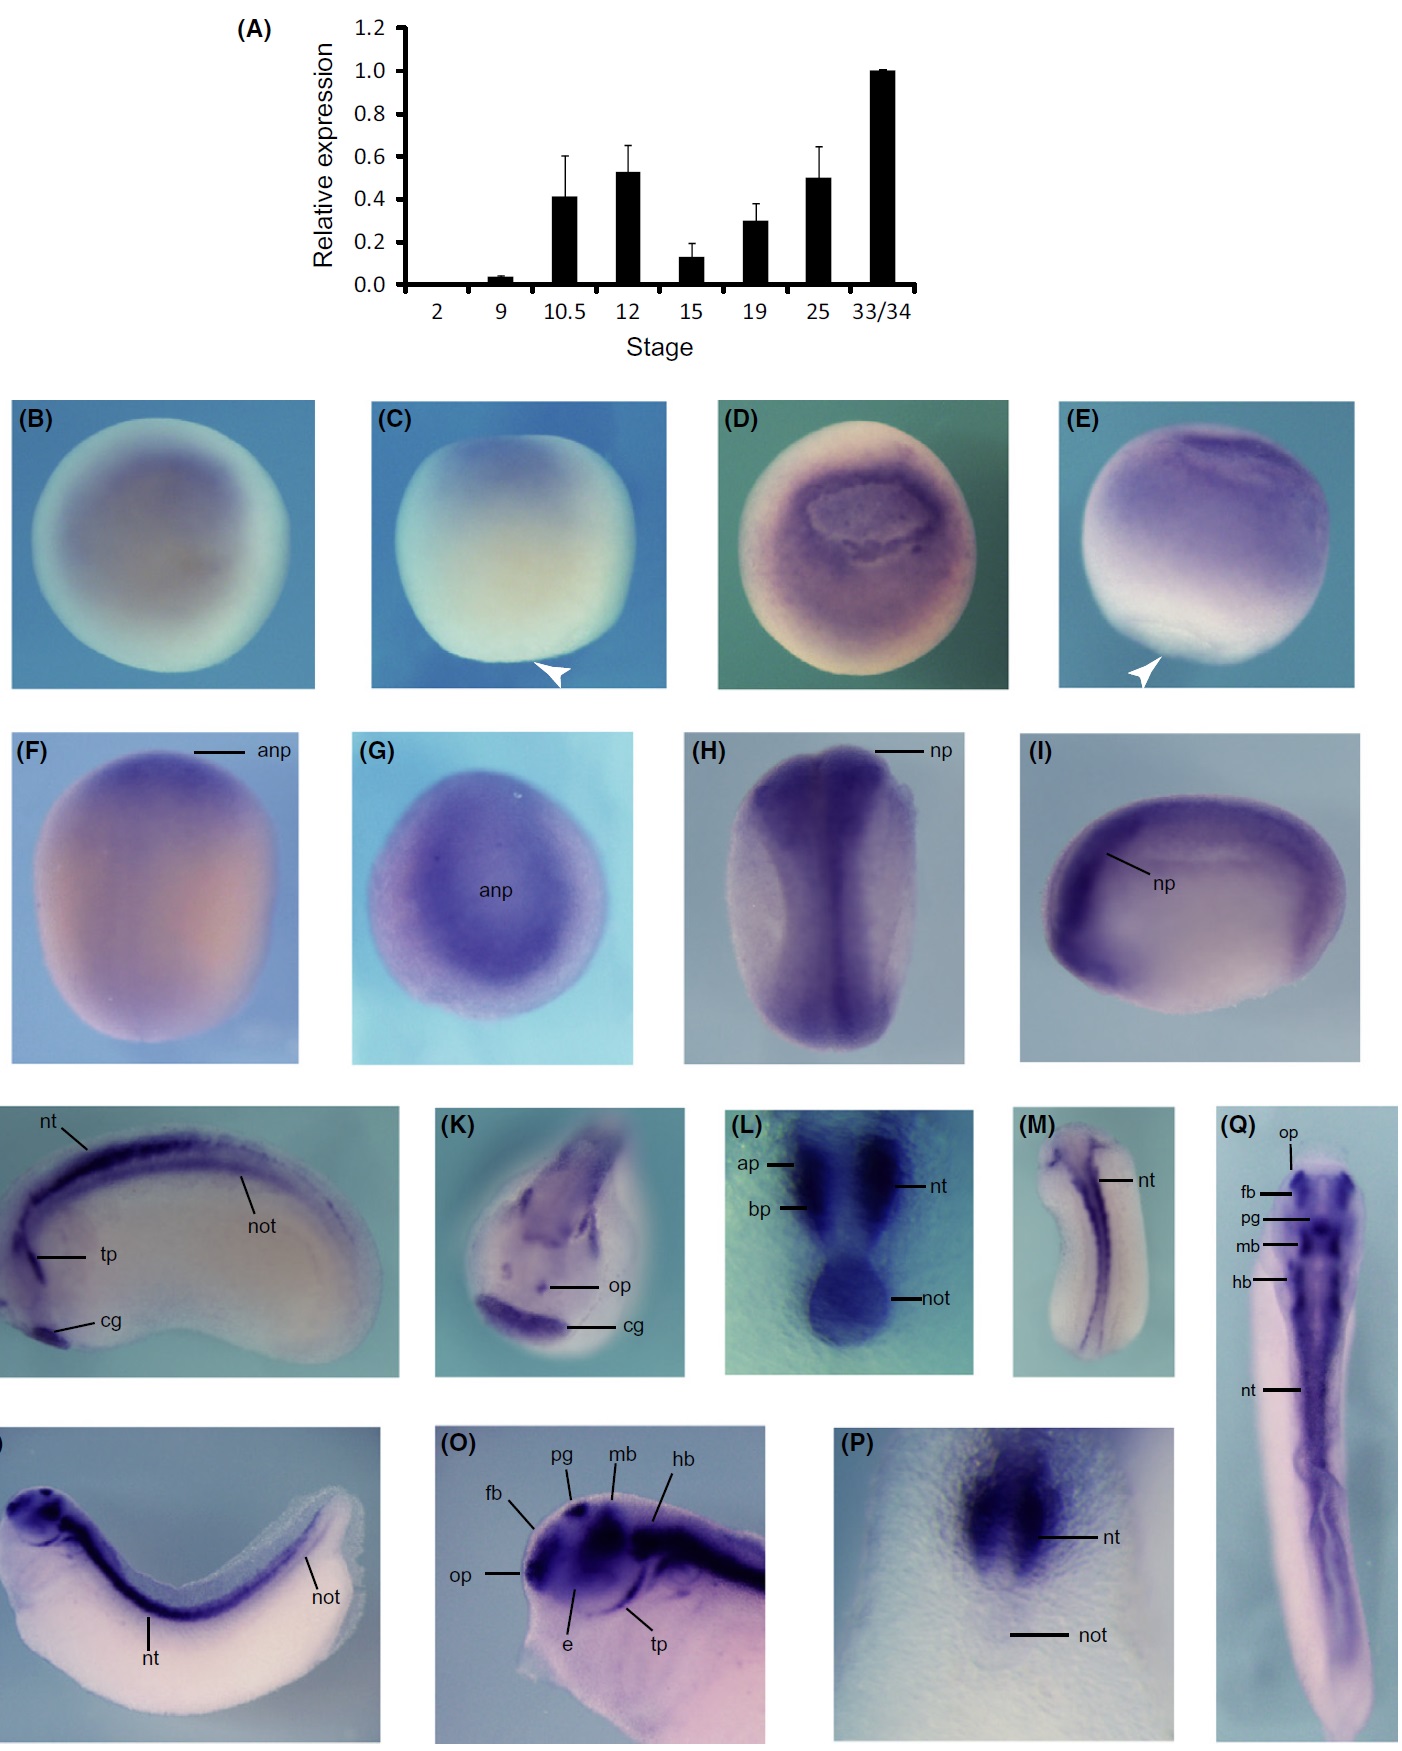
Figure 1 Expression of cnrip1 in early Xenopus development. (A) qRT-PCR analysis of cnrip1 mRNA expression during Xenopus
development. The expression level of cnrip1 was normalized to that of ornithine decarboxylase (odc). The bar graph indicates the average
ratio of the normalized expression level in each stage to that in stage 33/34, from three independent experiments. The error
bar represents SD. (BâQ) Whole-mount in situ hybridization for cnrip1 mRNA at stage 10.5 (B, C), 12 (D, E), 15 (F, G), 19 (H,
I), 25 (J-M), 33/34 (N-Q). (B, D) Animal views. (C, E) Lateral views with blastopores downwards (arrowheads). (F, H, M, Q)
Dorsal views with anterior upwards. (G, K) Anterior views with dorsal upwards. (I, J, N) Lateral views with dorsal upwards and
anterior leftwards. (L) A transverse trunk section of the middle part of a stage 25 embryo. (O) A magnified view of the stage 33/
34 embryo shown in N. (P) A transverse trunk section of the middle part of a stage 33/34 embryo. anp, anterior neural plate; np,
neural plate; nt, neural tube; not, notochord; cg, cement gland; tp, trigeminal placode; op, olfactory placode; fb, forebrain; pg,
pineal gland; mb, midbrain; hb, hindbrain; e, eye; ap, alar plate; bp, basal plate. Image published in: Zheng X et al. (2015) Copyright © 2015. Image reproduced with permission of the Publisher, John Wiley & Sons.
Image source: Published Larger Image Printer Friendly View |