XB-IMG-154365
Xenbase Image ID: 154365
|
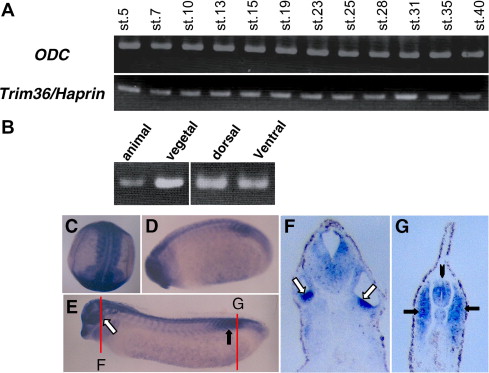
Fig. 2. Temporal and spatial expression pattern of X. laevis Trim36/Haprin during development. (A) RT-PCR analysis during X. laevis embryogenesis. The amount of input cDNA
was confirmed by PCR with ornithine decarboxylase primers (ODC). (B) RT-PCR analysis using each blastomere at the 8-cell embryos. Abbreviations: animal, animal pole cell;
vegetal, vegetal pole cell; dorsal, dorsal side cell; ventral, ventral side cell. (CâG) Whole-mount in situ hybridization analysis showed the localization of X. laevis Trim36/Haprin
transcripts. Dorsal views at stage 18 (C) are shown with the anterior region towards the bottom. Lateral views at stage 23 (D) and 28 (E) are shown with the anterior region
towards the left. Transverse sections at stage 28 at the head (F) and the posterior regions (G) are also shown. The positions of the sections are indicated in (E) as vertical lines.
Black arrows, white arrows and arrowheads indicate somites, eyes, and neural tubes, respectively. Image published in: Yoshigai E et al. (2009) Copyright © 2009. Image reproduced with permission of the Publisher, Elsevier B. V. Larger Image Printer Friendly View |