XB-IMG-159681
Xenbase Image ID: 159681
|
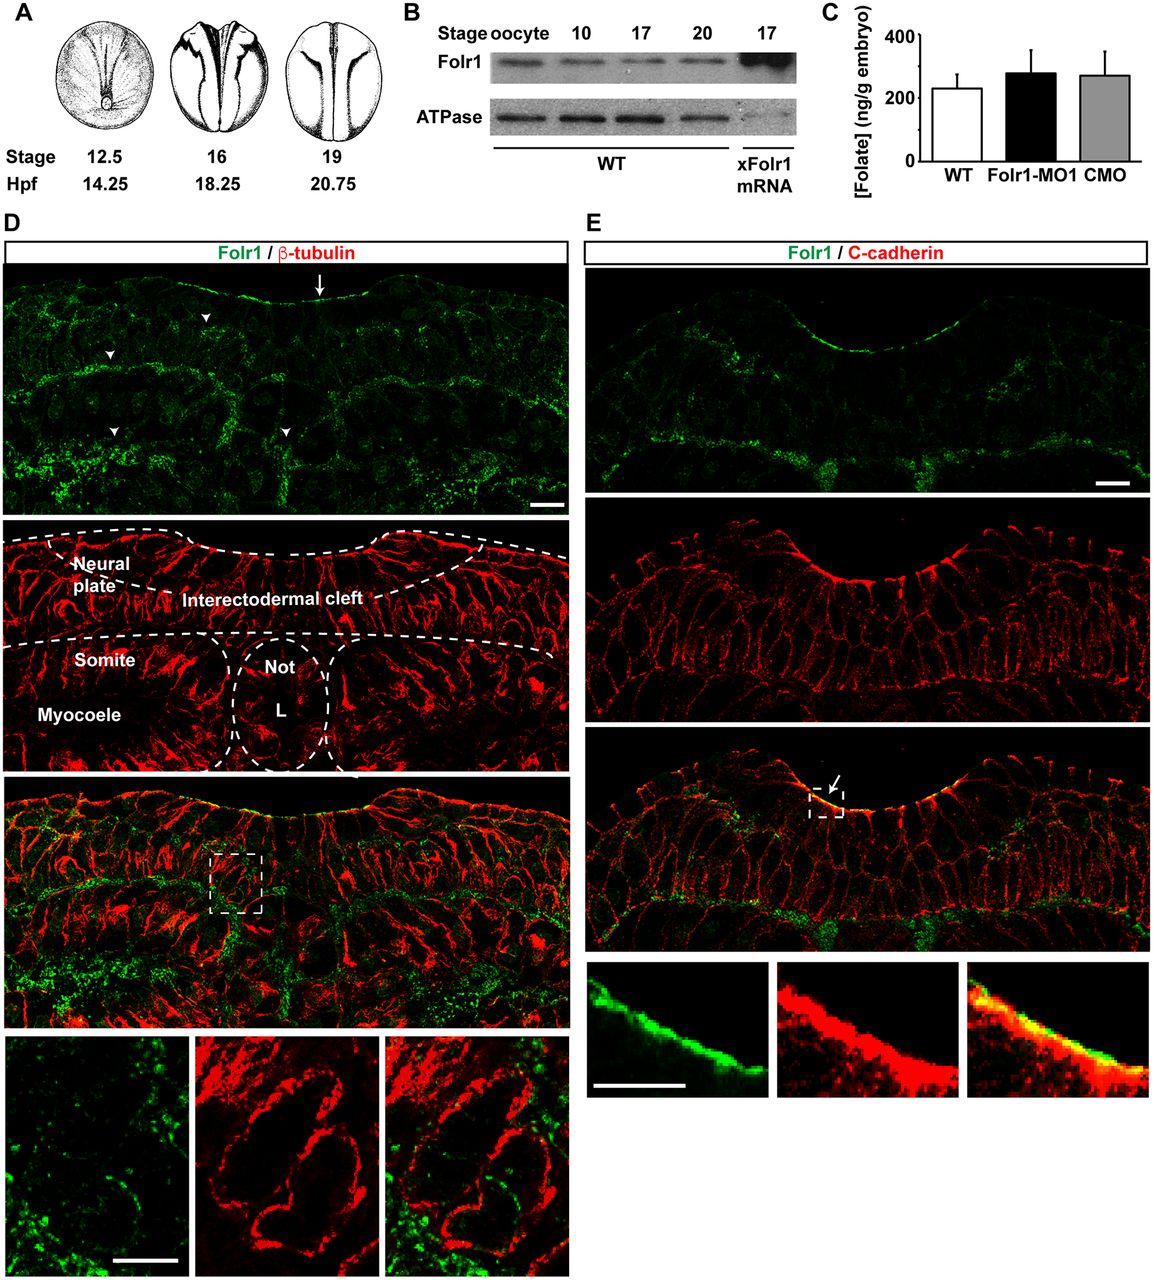
Fig. 1.
Folate receptor 1 expression during Xenopus laevis neural tube formation. (A) Time course of Xenopus laevis neurulation. hpf, hours post-fertilization. (B) Western blot assays from homogenates of wild-type (WT) or Xenopus laevis folate receptor 1 (Folr1)-overexpressing embryos at the indicated developmental stages. (C) Folate is present during Xenopus neural tube formation and folate levels do not change upon Folr1 knockdown. Data show folate levels measured by ELISA assay in homogenates from stage 13-17 (14.5-19â
hpf) WT, folate receptor 1 morpholino 1 (Folr1-MO1)- or standard control morpholino (CMO)-injected embryos. Mean±s.e.m.; n=8 independent measurements from n>40 embryos/group; average embryo weight: 2±0.4â
mg. (D,E) Neural plate stage embryos were processed for Folr1 (green) and β-tubulin (D, red) or C-cadherin (E, red) immunostaining. Shown are representative transverse sections of immunostained samples at neural plate stages 15 (D) and 17 (E). (D) Arrow in top panel indicates Folr1 localization at the apical neural plate surface and arrowheads indicate localization in extracellular spaces. Bottom panels show higher magnifications of the boxed area in the panel above and illustrate Folr1 localization to extracellular spaces. L, notochord lumen; Not, notochord. (E) Arrow indicates that Folr1 localizes to the apical neural plate surface along with adherens junction protein C-cadherin. Bottom panels show higher magnifications of the boxed area in the panel above. Scale bars: 20â
μm. Image published in: Balashova OA et al. (2017) Copyright © 2017. Image reproduced with permission of the Publisher and the copyright holder. This is an Open Access article distributed under the terms of the Creative Commons Attribution License.
Image source: Published Larger Image Printer Friendly View |