XB-IMG-175745
Xenbase Image ID: 175745
|
|
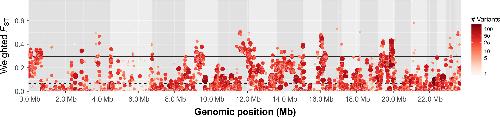
Figure 3
Sliding window analysis of population differentiation of Chilean Bd isolates against other BdGPL isolates using Weir and Cockerham's FST estimator. Each point represents a 10Kb genomic window, with a 5 kb step‐size. The dashed black line represents the mean FST (0.0679). The solid black line represents the 95% quantile threshold of the FST estimator (0.3141). Each point is sized and coloured on a log scale by the number of variants in each window. The legend indicates the colour scale (the number of SNPs included in each window varied from 1 to 177, with a median of 24). Point size from small to large is scaled from low to high numbers of variants [Colour figure can be viewed at wileyonlinelibrary.com] Image published in: Valenzuela-Sánchez A et al. (2018) Copyright © 2018. Image reproduced with permission of the Publisher. Larger Image Printer Friendly View |