XB-IMG-194359
Xenbase Image ID: 194359
|
||||||||||
|
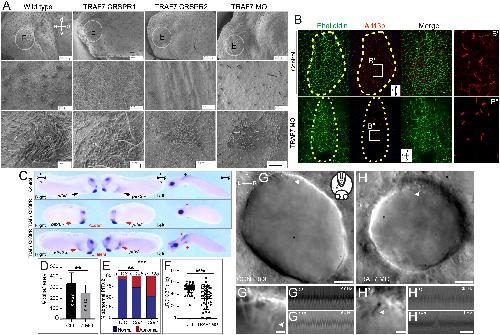
Figure 5. TRAF7 knockdown in Xenopus tropicalis (AâG) and zebrafish (HâJâââ) affects mono- and multi-cilia in the leftâright organizer (LRO). (A) Scanning electron microscopic images of Xenopus epidermis reveal defective cilia formation on TRAF7 depletion with either CRISPR #1, #2, or MO. Circled areas are magnified in the bottom panels. (Scale bars: Top row: 100 µm, middle row: 10 µm, bottom row: 3 µm.) (B) Xenopus embryos were injected at 1-cell stage and dorsal explants were prepared at stage 17 to visualize the leftâright organizer (LRO). Specimens were processed for immunohistochemistry (IHC) to assess ciliation rate and cell surface area. Compared to uninjected controls, TRAF7 morphants have fewer cilia, as shown by acetylated tubulin (red) and phalloidin (actin, to outline cell boundaries; green). a = anterior, l = left, p = posterior, r = right. C. Analysis of pitx2c expression in stage 28 to 30 Xenopus embryos. Embryos are viewed laterally from the right (first column), the left (second column), and ventrally (third column). Expression of pitx2c is normally in the left lateral plate mesoderm (LPM, black arrow). CRISPR-mediated TRAF7 knockdown results in abnormal absent pitx2c expression with no pitx2c mRNA found in the left or right LPM (Middle panel, red arrows); or abnormal bilateral pitx2c expression with pitx2c mRNA found in both left and right LPM (Bottom panel, red arrows). (D) Bar plot demonstrating quantification of ciliation in relation to cell surface area in the LRO of TRAF7 morphant and control X. tropicalis embryos in (C). **: P < 0.00: t test with Welch correction, n= # of embryos. E. Quantification of pitx2c expression in uninjected controls (UICs) and traf7-G0 mutants by sgRNA#1 and #2. Abnormal includes absent and bilateral pitx2c expression. Statistical calculations were performed using a Chi-square test comparing the number of affected embryos against the number of wild-type embryos. **P < 0.01, ***P < 0.001; n, number of analyzed tadpoles. (FâH). TRAF7 is required for proper motility of cilia in zebrafish LRO. (F) Quantification of the ciliary beating frequency (CBF) in control (60 cilia from eight embryos) and TRAF7 morphants (58 cilia from eight embryos). Mean control CBF= 50.5 Hz ± 7.14. Mean TRAF7 CBF = 33.47 ± 19.15. Two-sample t tests, P = 6.5 à 10â9; mean ± SD. Representative images of the LRO cilia of a control MO-injected embryo (eight somite stage) (G and Gâ) and of a TRAF7 MO-injected embryo (six somite stage) (H and Hâ) (Movies S7 and S8). (Scale bars: G, H = 10 µm; Gâ, Hâ = 2 µm.) White arrows indicate cilia. Gâ and Hâ are close-ups of the imaged regions in the anterior side of the LRO in G and H (Movies S9âS12). Representative kymographs of two individual âcontrolâ cilia (Gâ and Gâââ) and of TRAF7 knockdown cilia (Hââ and Hâââ). Kymograph total duration 500 ms. (Scale bar, 100 ms.)
Movie S6. Image published in: Mishra-Gorur K et al. (2023) Copyright © 2023 the Author(s). Creative Commons Attribution-NonCommercial-NoDerivatives license
Image source: Published Larger Image Printer Friendly View |