XB-IMG-24988
Xenbase Image ID: 24988
|
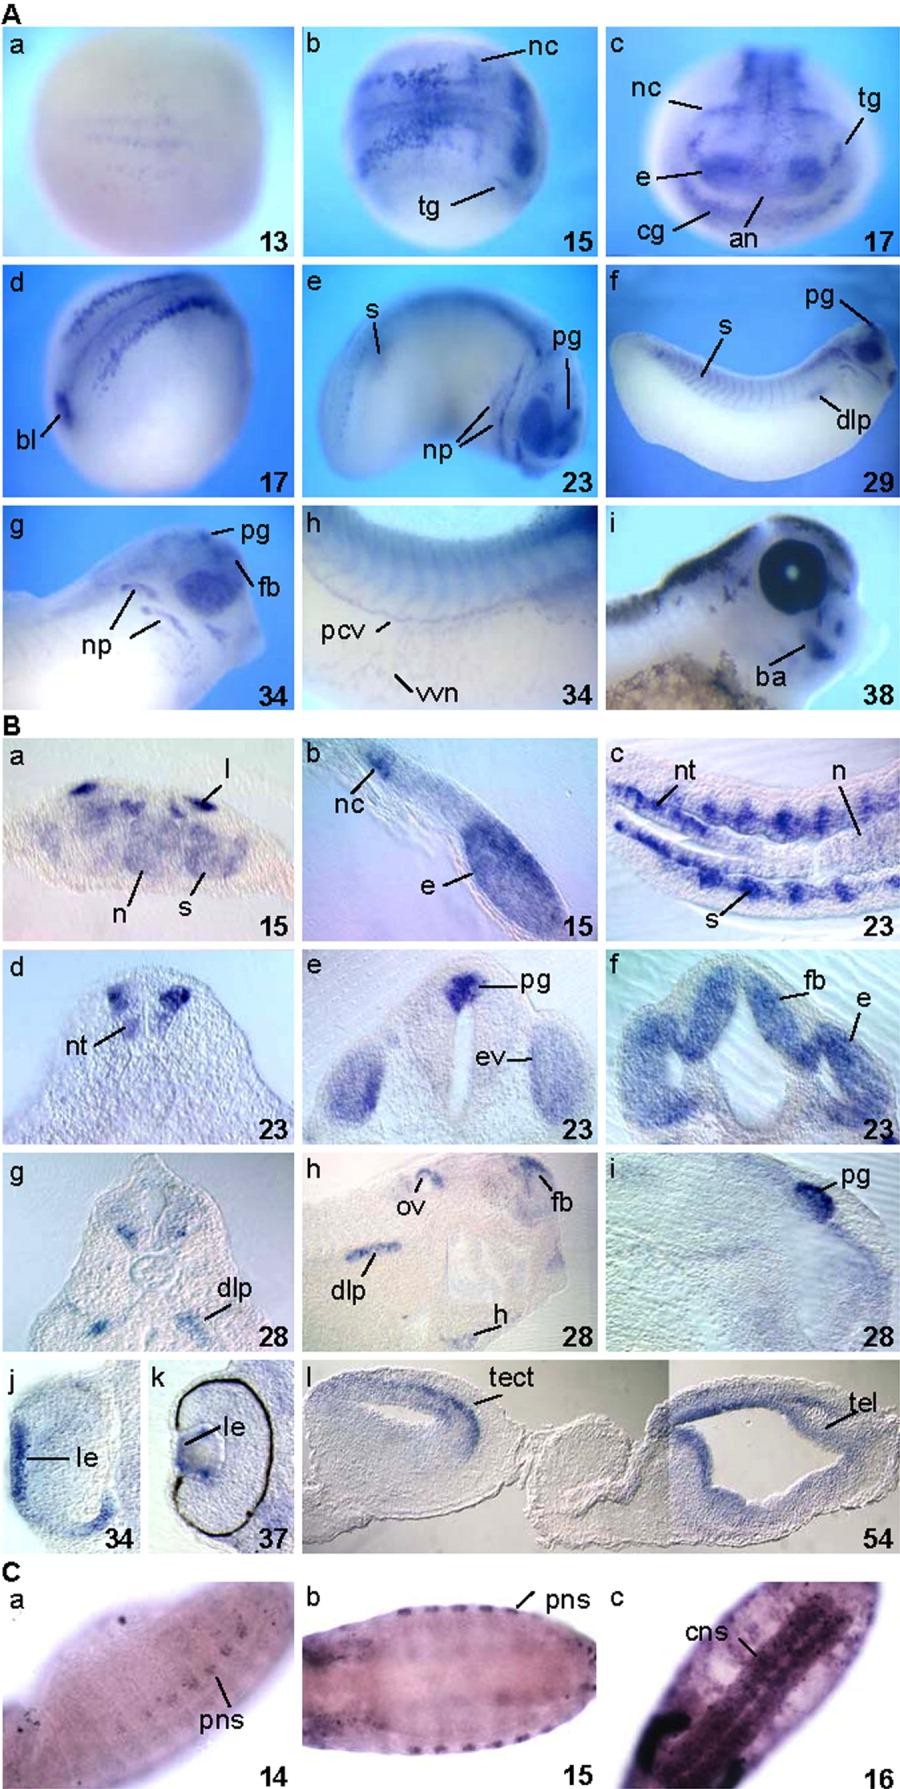
Figure 1. XBTBD6 and lute expression during embryogenesis. A: In situ analysis of XBTBD6 expression. a,b: Dorsal views. c: Anterior view. d-i: Lateral views. B: Sections of XBTBD6 stained embryos. a: Transversal section. b: Parasagittal section. c: Horizontal section. d,e: Transversal sections at the level of the eye and spinal cord. f: Horizontal section of the head. g-i: Transversal (g) and parasagittal (h,i) sections. j,k: Transversal sections of the eye. l: Parasagittal section of a tadpole brain. Nieuwkoop-Faber stages are indicated. C: In situ analysis of lute expression. a: Lateral view of a stage 14 embryo. b: Dorsal view of a stage 15 embryo. c: Ventral view of a stage 16 embryo. an, anterior neuroectoderm; ba, branchial arches bcs; bl, blastopore; cg, cement gland area; cnr, cephalic neurogenic region; cns, central nervous system; dlp, dorsal lateral plate mesoderm; e, eye; fb, forebrain; g, gut; h, heart; le, lens; n, notochord; nc, neural crest; np, neurogenic placode; nt, neural tube; ov, otic vesicle; pcv, posterior cardinal vein; pg, pineal gland; pns, peripheral nervous system; s, somites; ; tg, trigeminal ganglia; tel, telencephalon; tect, tectum; vvn, vascular vitelline network. Staging according to Nieuwkoop and Faber ([1967]). Image published in: Bury FJ et al. (2008) Copyright © 2008. Image reproduced with permission of the Publisher, John Wiley & Sons.
Image source: Published Larger Image Printer Friendly View |