XB-IMG-47045
Xenbase Image ID: 47045
|
||||||||||||||||||||||||||||||
|
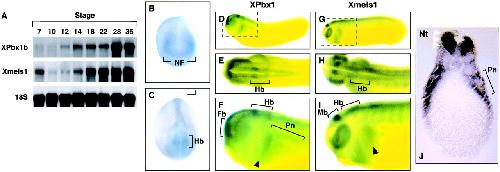
Figure 2 Temporal and spatial distribution of XPbx1b and Xmeis1 RNA expression during embryogenesis. (A) Northern blot analysis of RNA extracted from embryos at the indicated stages with Xpbx1b and Xmeis1 specific probe. The 18S RNA probe was used as a loading control. Whole mount in situ hybridization analysis of the tissue distribution of XPbx1b (BâF) and Xmeis1 (GâI) transcripts in X. laevis embryos. (B) Stage 15, anterior view. Note expression in lateral neural folds. (C) Stage 21, dorso-anterior view. Note strong staining in the presumptive hindbrain and along neural folds. (D) Lateral view of cleared stage-26 embryo. (E) Stage 26 dorsal view. (F) Enlarged lateral view of enclosure from D. Note the distinct Xpbx1 staining in the forebrain, hindbrain, and caudal branchial arch. (G) Lateral view of cleared stage-25 embryo. (H) Stage 25 dorsal view. (I) Enlarged lateral view of enclosure from G. Note strong expression of Xmeis1 in the midbrain, hindbrain, caudal and rostral branchial arches, and somites. (J) Transverse section through the pronephros of a stage-28 embryo. Note the strong Xpbx1 staining in lateral edge of neural tube (white arrowheads); expression also is observed in the lateral mesoderm surrounding the pronephritic anlage. (BâJ) Black arrowheads indicate caudal branchial arch. Black brackets denote the indicated tissues. Fb, forebrain; Hb, hindbrain; Mb, midbrain; NF, neural fold; Nt, neural tube; Pn, pronephros. Image published in: Maeda R et al. (2002) Copyright © 2002. Image reproduced with permission of the Publisher and the copyright holder. This is an Open Access article distributed under the terms of the Creative Commons Attribution License.
Image source: Published Larger Image Printer Friendly View |